DataFrame
官方教程:https://pandas.pydata.org/pandas-docs/stable/reference/api/pandas.DataFrame.html
如果想阅读更多内容,可以点击 👉 更多
入门帖子:https://pandas.pydata.org/pandas-docs/stable/user_guide/10min.html?

- DataScience Dataframe相关帖子:
如何创建一个Dataframe
# https://www.cnblogs.com/wenqiangit/p/11252741.html
# https://blog.csdn.net/weixin_38664232/article/details/97259159
# https://blog.csdn.net/weixin_41100555/article/details/88555658

import pandas as pd

series_city = pd.Series(["厦门", "福州", "杭州", "合肥"])
series_province = pd.Series(["福建", "福建", "浙江", "安徽"])

# dict to Dataframe
dict_city = {"city": series_city}
df_city = pd.DataFrame(dict_city)

# Create Dataframe Directly
data = [
    ["厦门", "福建"],
    ["福州", "福建"],
    ["杭州", "浙江"],
    ["合肥", "安徽"],
]
df = pd.DataFrame(data, columns=["城市", "省份"])

# Series to DataframeSig_series_df_city = series_city.to_frame(name="city") # single series

Se_to_df_city = pd.DataFrame({"city": series_city, "province": series_province}) # muti series
Se_to_df_city.rename(columns={"city": "城市"})

#  Application
df.head(2)
df.tail(2)
df.shape  # shape

df[['城市', '省份']] # slides
df.iloc[0, 0] # 厦门
df.iloc[0, :] # first row
df.iloc[:, 0] # first column
array to DataFrame:https://zhuanlan.zhihu.com/p/31966462
- pandas.Series转numpy的n维数组: https://www.cnblogs.com/Renyi-Fan/p/13655366.html
np.random.seed(1)
error = np.squeeze(np.random.randn(200, 1))

def ar_process(rho, b, error, num_iteration=200):
    y = []
    y_0 = 0
    for i in range(num_iteration):
        if i == 0:
            y.append(y_0)
        else:
            y.append(rho*y[i-1] + error[i] + b)
    return np.array(y).reshape(num_iteration, 1)

y_a = ar_process(1, 0, error, num_iteration=200) # a
y_b = ar_process(1, 0.5, error, num_iteration=200) # b
y_c = ar_process(1, -0.4, error, num_iteration=200) # c
y_d = ar_process(0.7, 0, error, num_iteration=200) # d
y_e = ar_process(0.7, 0.2, error, num_iteration=200) # d
y_f = ar_process(1.2, 0, error, num_iteration=200) # e

data_array = np.hstack([y_a, y_b, y_c, y_d, y_e, y_f])
data = pd.DataFrame(data_array, columns=['y_a', 'y_b', 'y_c', 'y_d', 'y_e', 'y_f']) #array to DataFrame
- Pandas中Series或者DataFrame判断某个元素是否在存在:https://blog.csdn.net/qq_35190319/article/details/89280372
bull类型进行判断:https://blog.csdn.net/qq_38115310/article/details/103290582
基本命令
0 查看信息(头部、尾部、描述统计)
如果数据量很大,可以通过groupby查看数据信息,想获取更多内容,可以点击 11 groupby
import pandas as pd
import requests
import json

PATH = 'https://raw.githubusercontent.com/rmpbastos/data_sets/main/kaggle_housing/house_df.csv'
df = pd.read_csv(PATH)
type(df)  # pandas.core.frame.DataFrame

df.head()  # head 5
df.tail()  # tail 5
df.shape  # (1460, 16)

df.dtypes  # 查看所有列的类型
df['收盘'].dtype # 查看某一列的类型

df.info()  # summary of df
df.describe()  # 描述性统计

df['Neighborhood'].value_counts()  # count
1 Index 设置
这里需要注意inplace=True是什么含义?inplace=True是对原有的Dataframe数据进行修改,而inplace=Flase是对原有的Dataframe数据不进行修改,建议用inplace=Flase。
# DataFrame index
df.set_index('Id', inplace=True)
df.index

df = pd.read_csv(PATH, index_col='Id')  # second method
index升序和降序处理:
df_data.set_index('date', inplace=True)
df_data = df_data.sort_index()
2 查看行和列
# rows and columns

df.columns

df['LotArea'].head()
type(df['LotArea'])  # pandas.core.series.Series

columns_test = test.columns.to_list()
3 修改列名称
df.rename(columns={'BedroomAbvGr': 'Bedroom'}, inplace=True)
df_copy = df.copy()  # copy dataframe
df_copy['Sold'] = 'N'  # add column(s)
df_copy.tail()

data_to_append = {'LotArea': [9500, 15000],
                  'Steet': ['Pave', 'Gravel'],
                  'Neighborhood': ['Downtown', 'Downtown'],
                  'HouseStyle': ['2Story', '1Story'],
                  'YearBuilt': [2021, 2019],
                  'CentralAir': ['Y', 'N'],
                  'Bedroom': [5, 4],
                  'Fireplaces': [1, 0],
                  'GarageType': ['Attchd', 'Attchd'],
                  'GarageYrBlt': [2021, 2019],
                  'GarageArea': [300, 250],
                  'PoolArea': [0, 0],
                  'PoolQC': ['G', 'G'],
                  'Fence': ['G', 'G'],
                  'SalePrice': [250000, 195000],
                  'Sold': ['Y', 'Y']}

df_to_append = pd.DataFrame(data_to_append)  # dict to dataframe
df_copy = df_copy.append(df_to_append, ignore_index=True)  # add row(s)
df_copy.tail()

df_copy.drop(labels=1461, axis=0, inplace=True)  # remove row(s) ; axis = 0
df_copy.drop(labels='Fence', axis=1, inplace=True)  # remove column(s) ; axis = 1

# https://blog.csdn.net/lvlinjier/article/details/112877577
df.drop(df.tail(n).index) #从尾部去掉 n 行
df.dorp(df.head(n).index) #从头去掉 n 行
4 Dataframe 位置索引
loc
# loc is used to access rows and columns by label/index or based on a boolean array
df.loc[1000]  # the 1000th row; index = 1000
df.loc[1000, ['LotArea', 'SalePrice']]  # index = 1000; columns = ['LotArea', 'SalePrice']
df.loc[df['SalePrice'] >= 600000]  # df['SalePrice'] >= 600000 is condion; return boolen
iloc
# iloc is used to select data based on their integer location or based on a boolean array as well
df.iloc[0, 0]  # 1st row; 1st column
df.iloc[10, :]  # 10th column
df.iloc[:, -1]  # the last colums
df.iloc[8:12, 2:5]

df.isnull()  # detecting the missing values
df.isnull().sum()  # the sum of missing values per column
df.isnull().sum() / df.shape[0]  # ratio
5 缺失值处理
# ratio > 0
for column in df.columns:
    if df[column].isnull().sum() > 0:
        print(column, ': {:.2%}'.format(df[column].isnull().sum() / df[column].shape[0]))

df_toremove = df.copy()  # copy to drop
df_toremove.drop(labels=['PoolQC'], axis=1, inplace=True)  # drop column(s)
df_toremove.dropna(subset=['GarageType'], axis=0, inplace=True)  # drop rows

df_tofill = df.copy()  # copy to fill the null
df_tofill['Fence'].fillna(value='NoFence', inplace=True)  # fiil all in the column['Fence']

garage_median = df_tofill['GarageYrBlt'].median()  # fill the median
df_tofill.fillna({'GarageYrBlt': garage_median}, inplace=True)
如何判断存在Nan:https://blog.csdn.net/S_o_l_o_n/article/details/100661937; 并用bull值进行替换:https://www.jianshu.com/p/6e0a62fc1a83
6 文件保存
df['SalePrice'].plot(kind='hist');  # Histograms
df.plot(x='SalePrice', y='YearBuilt', kind='scatter')  # scatter

df.to_csv(r'./Python_经济知识综合/My_DataFrame.csv')  # save by the relative path
df.to_csv('C:/Users/username/Documents/My_DataFrame.csv')  # absolute path
7 滞后阶数
df.shift(1) # 滞后一阶
时间戳
- https://pandas.pydata.org/pandas-docs/stable/reference/api/pandas.Series.dt.year.html
- 5位时间戳转化:https://www.cnblogs.com/bigtreei/p/10301099.html
- 10位时间戳:https://blog.csdn.net/weixin_37659245/article/details/96429272
8 Dataframe.plot
plt.figure(figsize=(10, 8))
i = 1

  # 在一个循环框架下:
  ax = plt.subplot(1, 2, i)
  df_data.loc[:, ['hs300', 'sr_' + column, 'lr_' + column]].plot(ax=ax)
  i =  i + 1
9 Pandas绘图中文显示
- https://zhuanlan.zhihu.com/p/371822424
- 子图绘制 ax控制:https://blog.csdn.net/Leon_Kbl/article/details/98111123
10 Dataframe数据类型转化
- Pandas 将字符串转换为数字类型:https://www.delftstack.com/zh/howto/python-pandas/pandas-convert-string-to-numeric-type/
- 互相转换:https://blog.csdn.net/wangwangstone/article/details/114791264
pd.to_numeric(df['收盘'].str.replace(',', '')) # 字符串类型转换为float
11 groupby
- Pandas教程 | 超好用的Groupby用法详解:https://zhuanlan.zhihu.com/p/101284491
groupby之后的数据类型为:pandas.core.groupby.generic.DataFrameGroupBy, 更多详细内容,可以查看 👉 更多
df = pd.DataFrame([{'name': 'Albert', 'store': 175, 'sales': 109, 'clients': 28},
{'name': 'Sharon', 'store': 129, 'sales': 208, 'clients': 248},
{'name': 'Albert', 'store': 275, 'sales': 524, 'clients': 78},
{'name': 'Sharon', 'store': 399, 'sales': 913, 'clients': 921},
{'name': 'Sharon', 'store': 851, 'sales': 482, 'clients': 527},
{'name': 'Albert', 'store': 974, 'sales': 314, 'clients': 323},
{'name': 'Pink', 'store': 868, 'sales': 532, 'clients': 273},
{'name': 'Angelina', 'store': 4, 'sales': 31, 'clients': 347}])
df.groupby('name')[['sales', 'clients']].sum()
df.groupby('name').get_group('Albert')
df.groupby('name').first() # each first row of each group
df.groupby('name').last()
df.groupby('name').nth(1) # 2nd Row of each group
df.sort_values(by='sales',
ascending=False, ).groupby('name').first() # Sort and get the first value of each group
df.groupby('name').groups # return dict
df.groupby('name').size() # size of group(s)
df.groupby('name').ngroups # number of group(s)
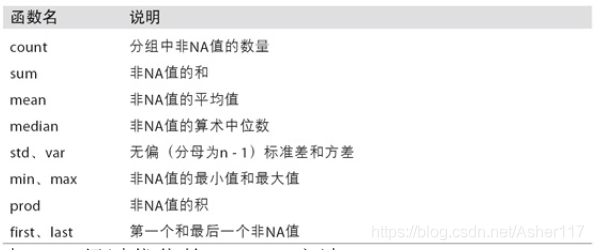
df.groupby('name').agg({'store': 'count', 'sales': 'sum', 'clients': 'mean'})
df.groupby('name').agg(['sum', 'mean'])
df.groupby('name').plot() # plot
df.groupby('name').transform(lambda x: x.fillna(x.mean())) # transform
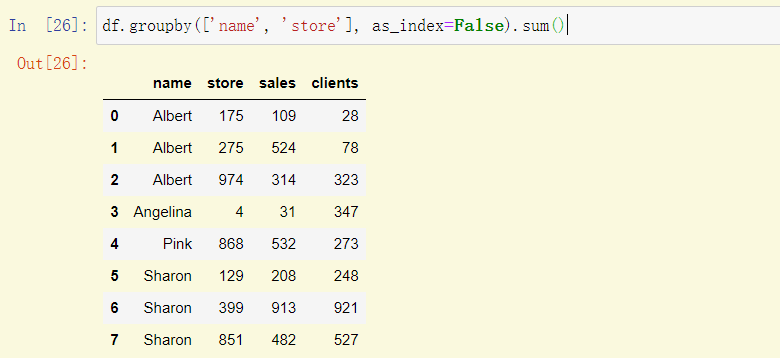
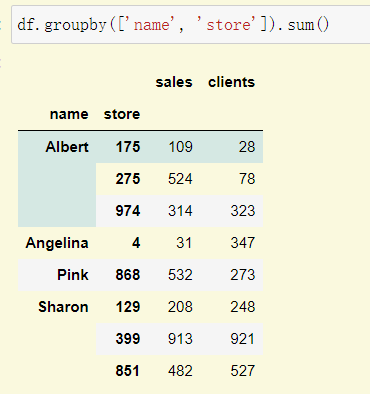
如果group多列,此时出现多个index,该怎们办?
- https://mp.weixin.qq.com/s/e1R1bVB-PxXyB0wPt87W7w
- Pandas根据字段(列)查看具体有哪些重复的数据:https://blog.csdn.net/qq_41780234/article/details/106906390
df.groupby(['name', 'store'], as_index=False).sum()
df.groupby(['name', 'store']).sum()
【Python】分组统计GroupBy技术详解: https://blog.csdn.net/Asher117/article/details/85614034
逆序
- Pandas条件筛选并赋值: https://blog.csdn.net/puhuihui/article/details/119450377
- Mask(根据一列的条件来替换另一列的值):https://www.jianshu.com/p/6e0a62fc1a83
- Pandas if条件:http://www.361way.com/if-condition-in-pandas/6362.html
- DataFrame Transpose: https://blog.csdn.net/a19990412/article/details/90744905
- pandas.DataFrame.round 取小数点几位(numpy.around, Series.round): https://blog.csdn.net/lancegentry/article/details/99715424
- Python Pandas DataFrame 表格 打印输出不能对齐的两种解决方案

 浙公网安备 33010602011771号