EFK安装部署
EFK
环境说明
16g内存刚好跑满百分之95
| 名称 | ip | cpu | 内存 |
| filebeat | 192.168.1.11 | 2 | 2 |
| kibana | 192.168.1.21 | 2 | 2 |
| elasticsearch-1 | 192.168.1.31 | 2 | 3 |
| elasticsearch-2 | 192.168.1.32 | 2 | 3 |
| elasticsearch-3 | 192.168.1.33 | 2 | 3 |
版本说明
▷ elasticsearch 7.3.2
▷ filebeat 7.3.2
▷ kibana 7.3.2
▷ 三个组件版本必须一致
▷ elasticsearch必须3台以上且总数量为单数
调整elasticsearch文件描述符
vi /etc/security/limits.conf
* hard nofile 102400
* soft nofile 102400

#三台elastic都要调整,要不然起不来
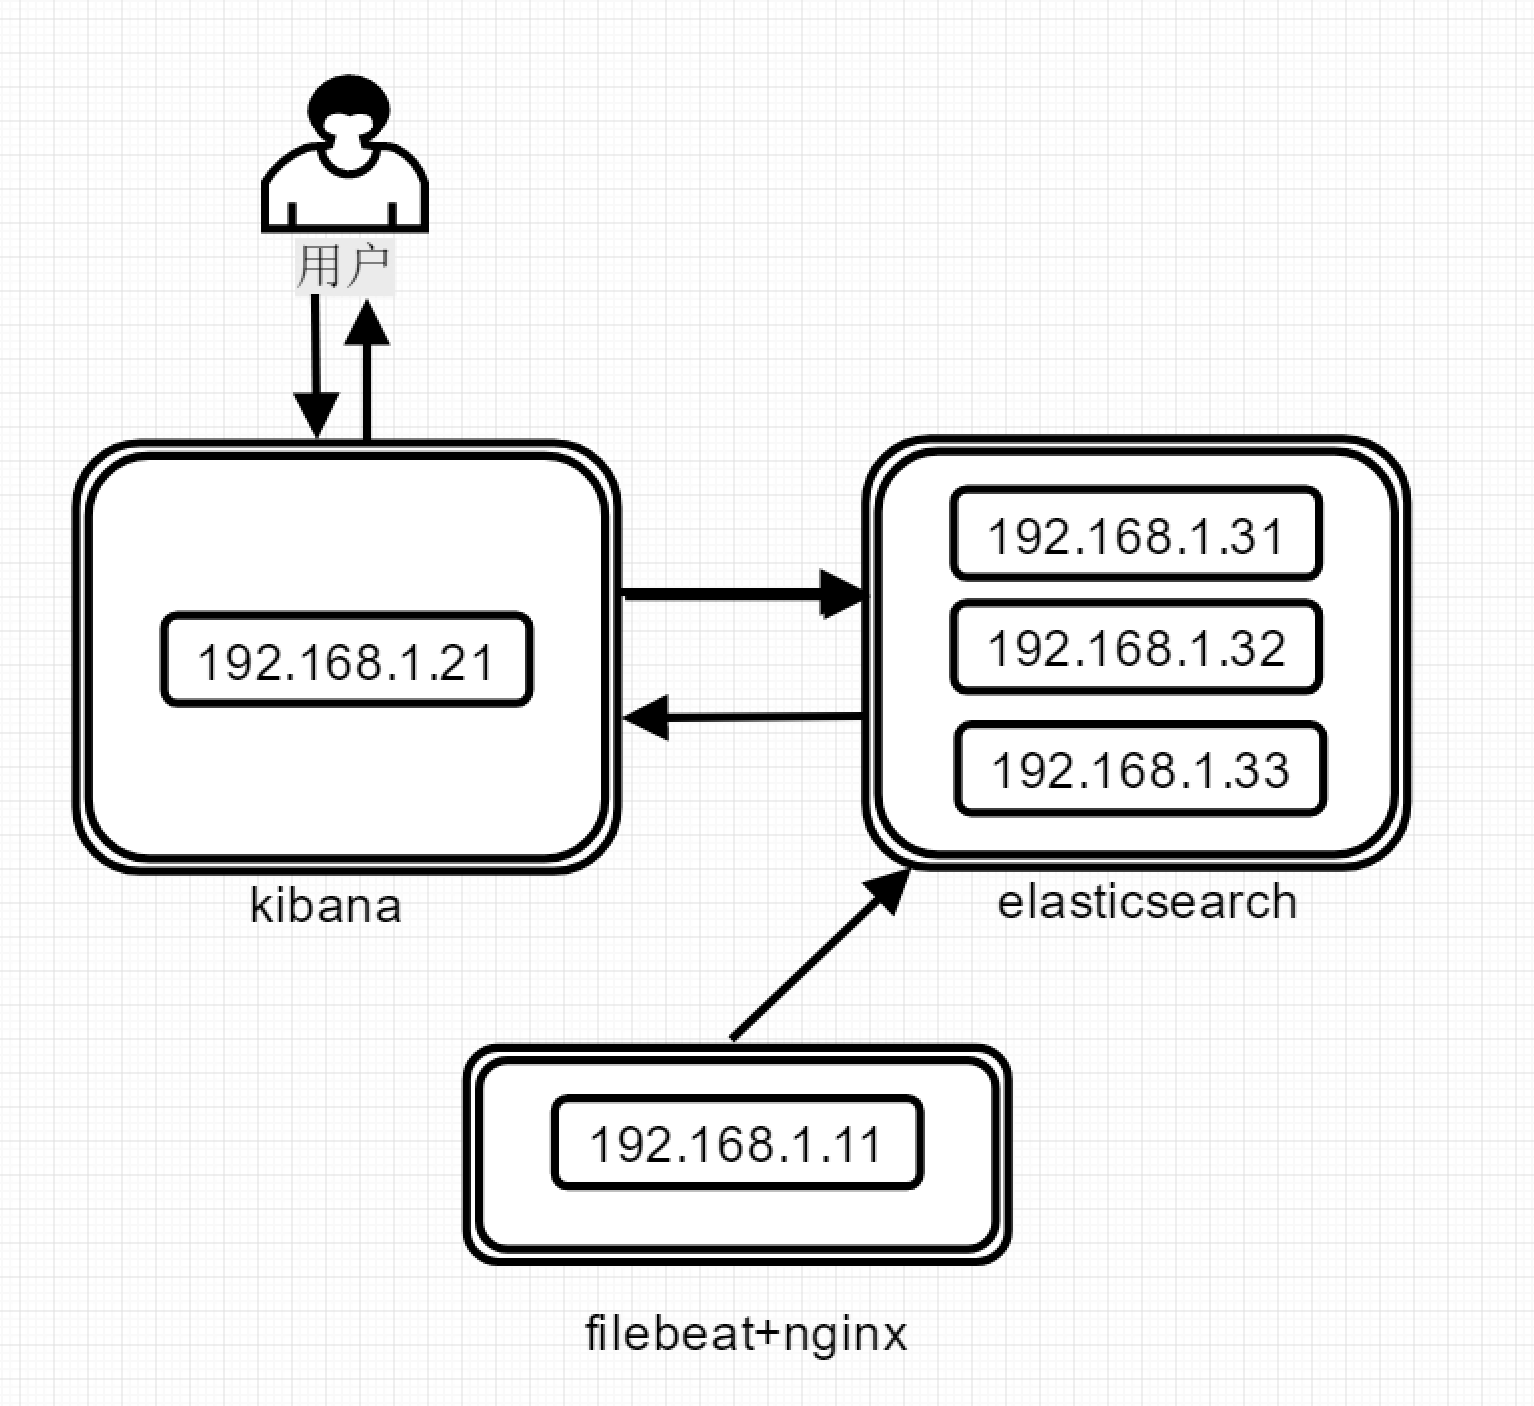
架构图:
安装步骤
安装路径
▷ /opt/elasticsearch
▷ /opt/filebeat
▷ /opt/kibana
elasticsearch安装:3台es均执行相同的安装步骤
mkdir -p /opt/software && cd /opt/software
wget https://artifacts.elastic.co/downloads/elasticsearch/elasticsearch-7.3.2-linux-x86_64.tar.gz
tar -zxvf elasticsearch-7.3.2-linux-x86_64.tar.gz
mv elasticsearch-7.3.2 /opt/elasticsearch
useradd elasticsearch -d /opt/elasticsearch -s /sbin/nologin
mkdir -p /opt/logs/elasticsearch
chown elasticsearch.elasticsearch /opt/elasticsearch -R
chown elasticsearch.elasticsearch /opt/logs/elasticsearch -R


# 限制一个进程可以拥有的VMA(虚拟内存区域)的数量要超过262144,不然elasticsearch会报max virtual memory areas vm.max_map_count [65535] is too low, increase to at least [262144]
echo "vm.max_map_count = 655350" >> /etc/sysctl.conf
sysctl -p
#这些命令相信大家都看得懂
filebeat安装
mkdir -p /opt/software && cd /opt/software
wget https://artifacts.elastic.co/downloads/beats/filebeat/filebeat-7.3.2-linux-x86_64.tar.gz
mkdir -p /opt/logs/filebeat/
tar -zxvf filebeat-7.3.2-linux-x86_64.tar.gz
mv filebeat-7.3.2-linux-x86_64 /opt/filebeat
kibana安装
mkdir -p /opt/software && cd /opt/software
wget https://artifacts.elastic.co/downloads/kibana/kibana-7.3.2-linux-x86_64.tar.gz
tar -zxvf kibana-7.3.2-linux-x86_64.tar.gz
mv kibana-7.3.2-linux-x86_64 /opt/kibana
useradd kibana -d /opt/kibana -s /sbin/nologin
chown kibana.kibana /opt/kibana -R
nginx安装
# 和filebeat装一台
yum install -y nginx
systemctl restart nginx
elasticsearch配置(三台全部配置记得修改ip)
192.168.1.31(32,33) /opt/elasticsearch/config/elasticsearch.yml
# 集群名字
cluster.name: my-application
# 节点名字
node.name: 192.168.1.31
# 日志位置
path.logs: /opt/logs/elasticsearch
# 本节点访问IP
network.host: 192.168.1.31
# 本节点访问
http.port: 9200
# 节点运输端口
transport.port: 9300
# 集群中其他主机的列表
discovery.seed_hosts: ["192.168.1.31", "192.168.1.32", "192.168.1.33"]
# 首次启动全新的Elasticsearch集群时,在第一次选举中便对其票数进行计数的master节点的集合
cluster.initial_master_nodes: ["192.168.1.31", "192.168.1.32", "192.168.1.33"]
# 启用跨域资源共享
http.cors.enabled: true
http.cors.allow-origin: "*"
# 只要有2台数据或主节点已加入集群,就可以恢复
gateway.recover_after_nodes: 2
filebeat配置
192.168.1.11 /opt/filebeat/filebeat.yml
# 文件输入
filebeat.inputs:
  # 文件输入类型
  - type: log
    # 开启加载
    enabled: true
    # 文件位置
    paths:
      - /var/log/nginx/access.log
    # 自定义参数
    fields:
      type: nginx_access  # 类型是nginx_access,和上面fields.type是一致的


# 输出至elasticsearch
output.elasticsearch:
  # elasticsearch集群
  hosts: ["http://192.168.1.31:9200",
          "http://192.168.1.32:9200",
          "http://192.168.1.33:9200"]


  # 索引配置
  indices:
    # 索引名
    - index: "nginx_access_%{+yyy.MM}"
      # 当类型是nginx_access时使用此索引
      when.equals:
        fields.type: "nginx_access"


# 关闭自带模板
setup.template.enabled: false


# 开启日志记录
logging.to_files: true
# 日志等级
logging.level: info
# 日志文件
logging.files:
  # 日志位置
  path: /opt/logs/filebeat/
  # 日志名字
  name: filebeat
  # 日志轮转期限,必须要2~1024
  keepfiles: 7
  # 日志轮转权限
  permissions: 0600
kibana配置
192.168.1.21 /opt/kibana/config/kibana.yml
# 本节点访问端口
server.port: 5601


# 本节点IP
server.host: "192.168.1.21"


# 本节点名字
server.name: "192.168.1.21"


# elasticsearch集群IP
elasticsearch.hosts: ["http://192.168.1.31:9200",
                      "http://192.168.1.32:9200",
                      "http://192.168.1.33:9200"]
i18n.locale: "zh-CN"    #设置语言为中文,kibana7版本加入的
启动服务
# elasticsearch启动(3台es均启动)
sudo -u elasticsearch /opt/elasticsearch/bin/elasticsearch


# filebeat启动
/opt/filebeat/filebeat -e -c /opt/filebeat/filebeat.yml -d "publish"


# kibana启动
sudo -u kibana /opt/kibana/bin/kibana -c /opt/kibana/config/kibana.yml
kibana界面:
1️⃣ 使用浏览器访问192.168.1.21:5601,看到以下界面表示启动成功
2️⃣ 点"Try our sample data"
3️⃣ "Help us improve the Elastic Stack by providing usage statistics for basic features. We will not share this data outside of Elastic"点"no”
4️⃣ “Add Data to kibana"点"Add data”
5️⃣ 进入视图
点View data下弹小窗口点Dashboarb
测试
访问nginx,生成日志
curl -I "http://192.168.1.11"
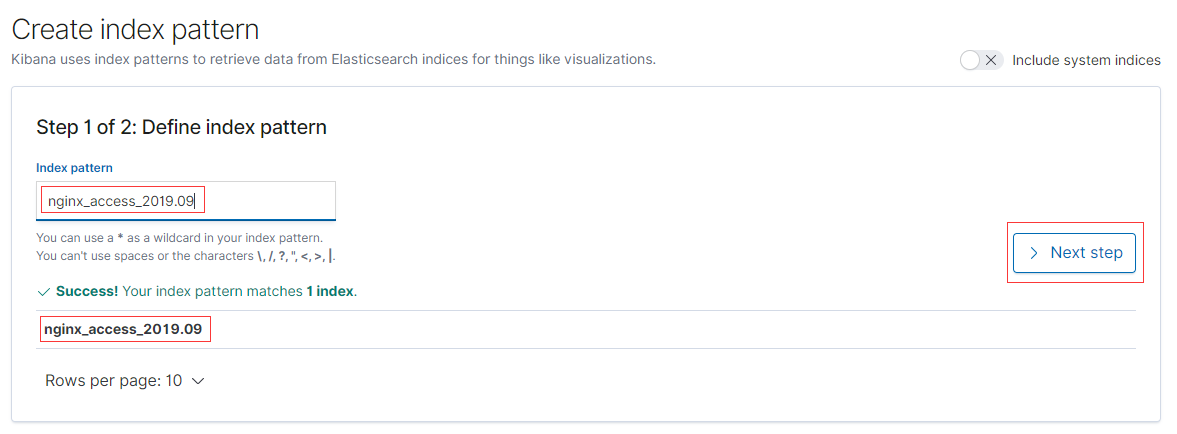
1️⃣ 创建索引模板
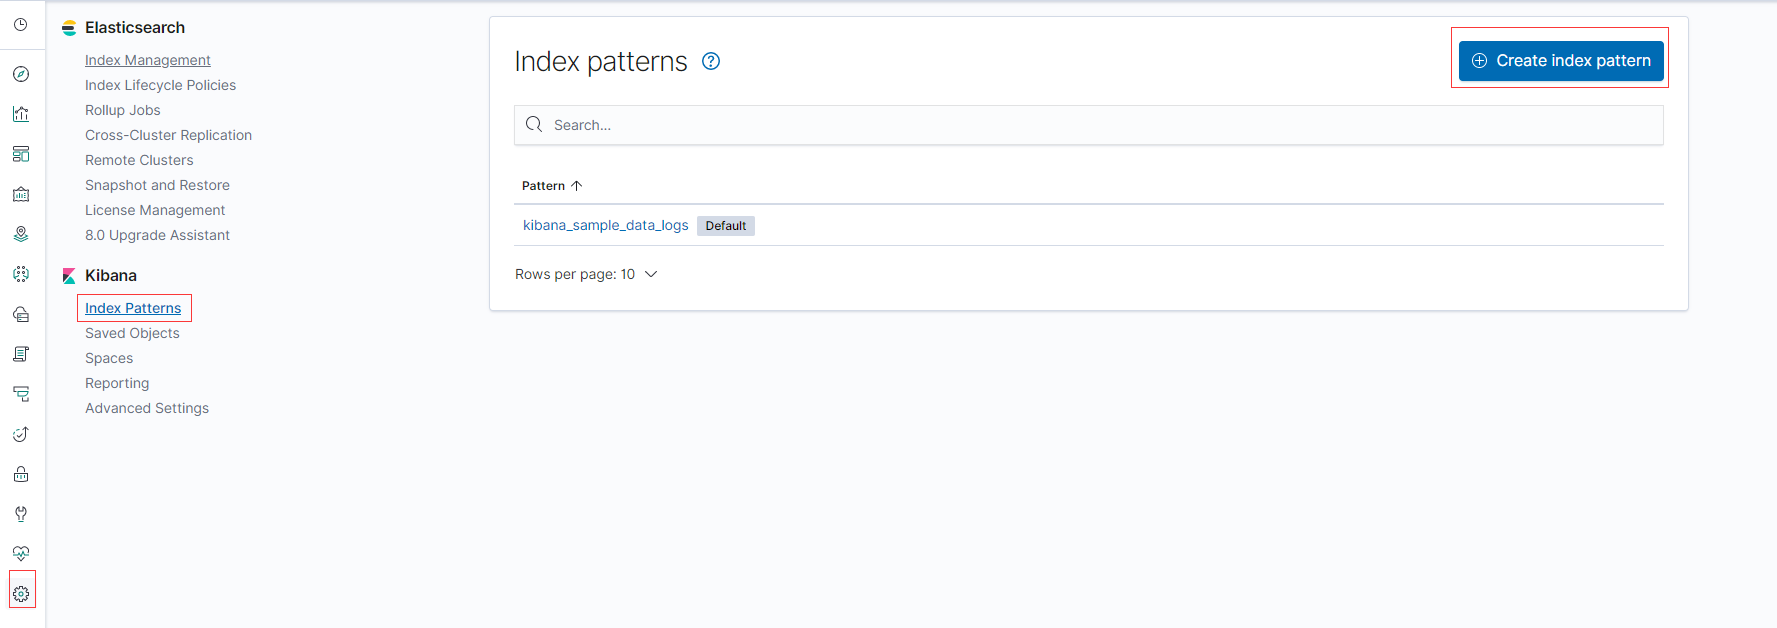
2️⃣ 输入你要创建的索引模板的名字
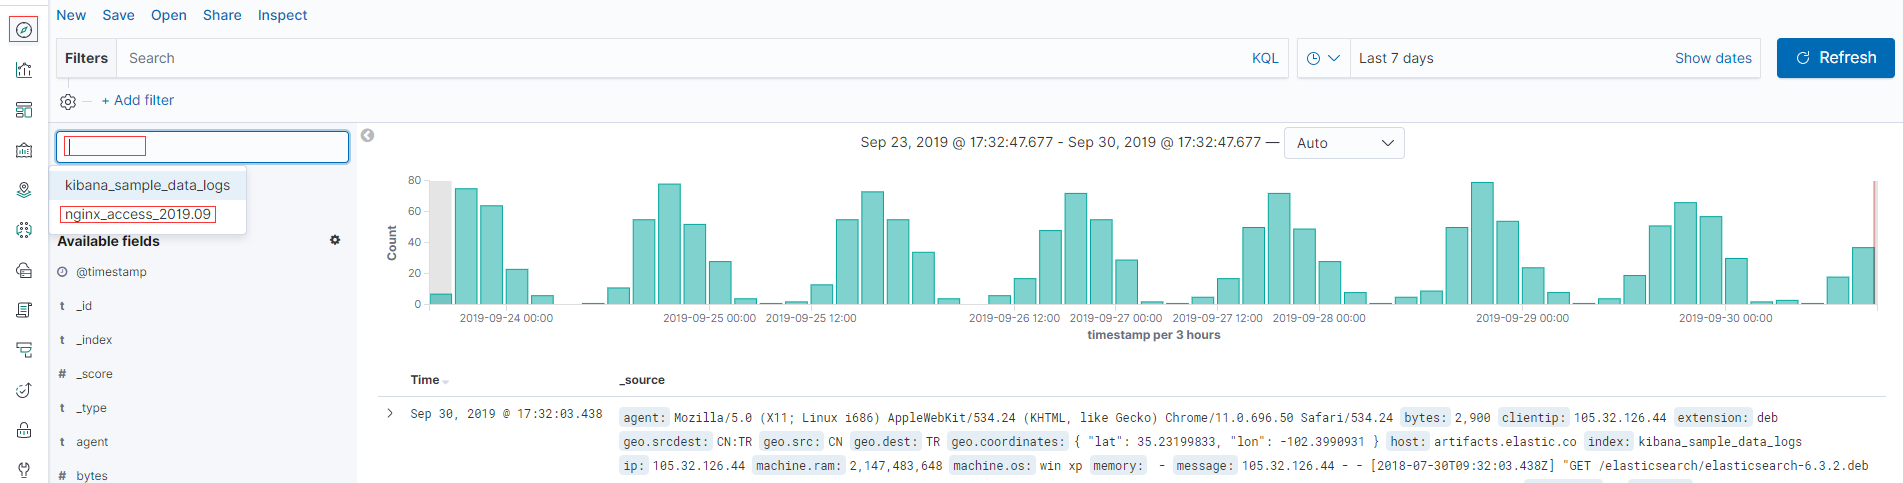
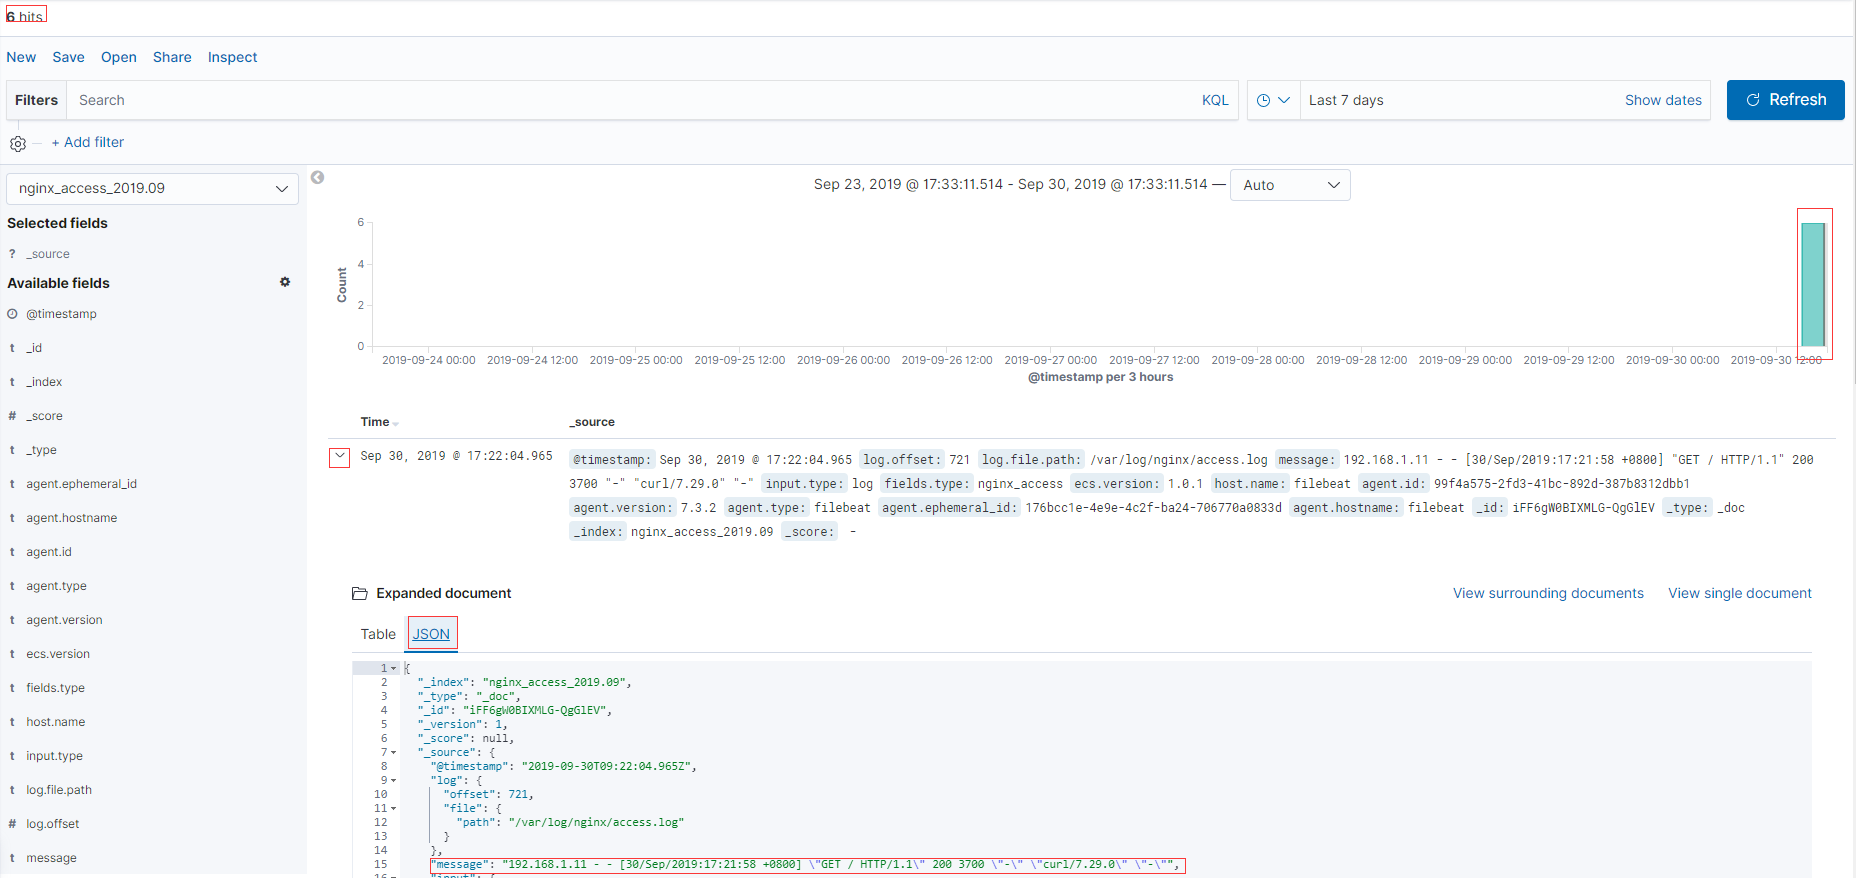
3️⃣ 查看之前CURL的数据

 浙公网安备 33010602011771号