

基于RStudio 实现数据可视化之二
1、数据预览
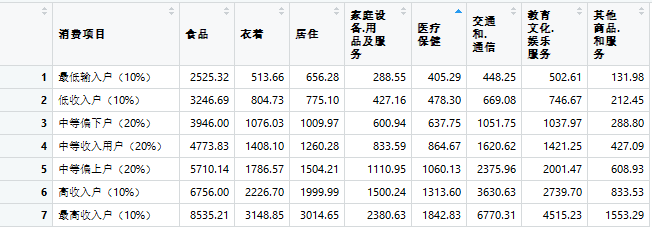
注:(数据来源于国家统计局)
2、轮廓图
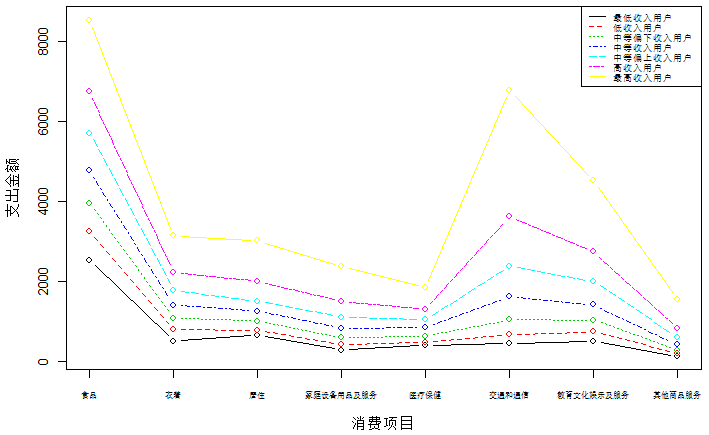
> par(mai=c(0.7,0.7,0.1,0.1),cex=0.8)
> matplot(t(income[,2:9]),type="b",lty = 1:7,col=1:7,xlab = "消费项目",ylab = "支出金额",pch = 1,xaxt="n")
> axis(side = 1,at=1:8,labels = c("食品","衣着","居住","家庭设备用品及服务","医疗保健","交通和通信","教育文化娱乐及服务","其他商品服务"),cex.axis=0.6)
> legend(x="topright",legend = c("最低收入用户","低收入用户","中等偏下收入用户","中等收入用户","中等偏上收入用户","高收入用户","最高收入用户"),lty=1:7,col=1:7,text.width=1,cex=0.7)
3、雷达图
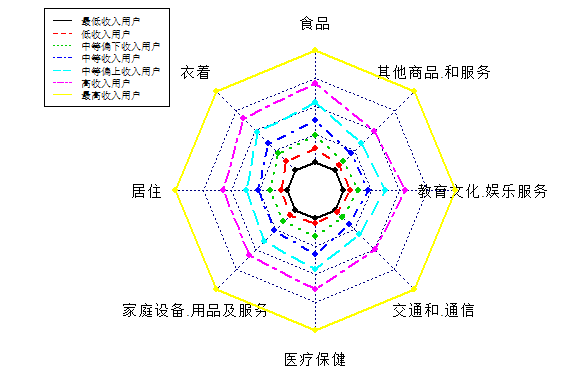
> radarchart(income[,2:9],axistype = 0,seg = 4,maxmin = FALSE,vlabels = names(income[,2:9]),pcol = 1:7,plwd = 2.0)
> legend(x="topleft",legend = c("最低收入用户","低收入用户","中等偏下收入用户","中等收入用户","中等偏上收入用户","高收入用户","最高收入用户"),lty=1:7,col=1:7,text.width=0.6,lwd=0.8,cex=0.8)
4、星图
4.1、不同收入等级的星图
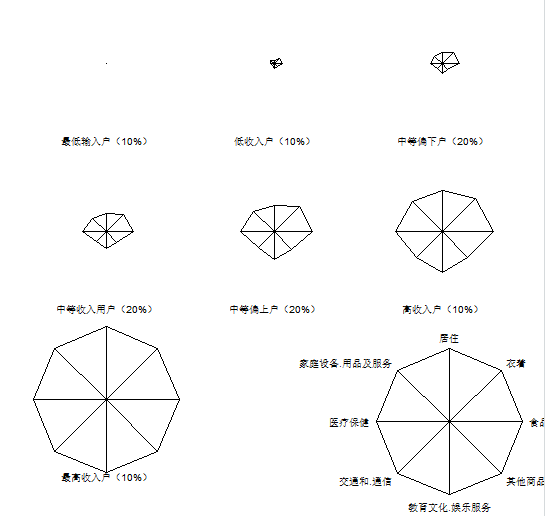
stars(income_matrix,key.loc=c(7,2,5),cex=0.8)
4.2、不同消费项目的星图
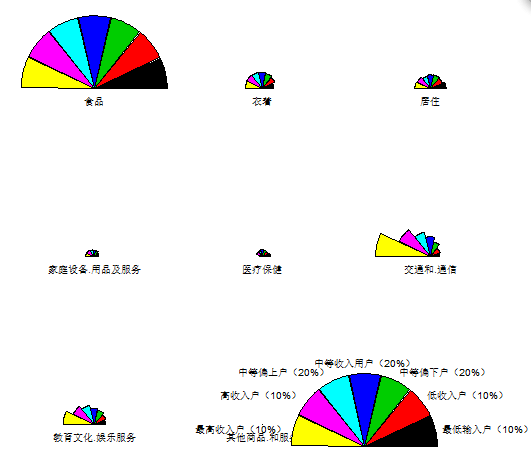
> stars(t(income_matrix),full = FALSE,draw.segments = TRUE, key.loc=c(6,2,5),cex=0.8)
5、脸谱图
> install.packages("aplpack")
trying URL 'https://dirichlet.mat.puc.cl/bin/windows/contrib/3.5/aplpack_1.3.2.zip'
Content type 'application/zip' length 3608846 bytes (3.4 MB)
downloaded 3.4 MB
package ‘aplpack’ successfully unpacked and MD5 sums checked
The downloaded binary packages are in
C:\Users\AppData\Local\Temp\Rtmp4aNIAV\downloaded_packages
> library(aplpack)
载入需要的程辑包:tcltk
> library(aplpack)
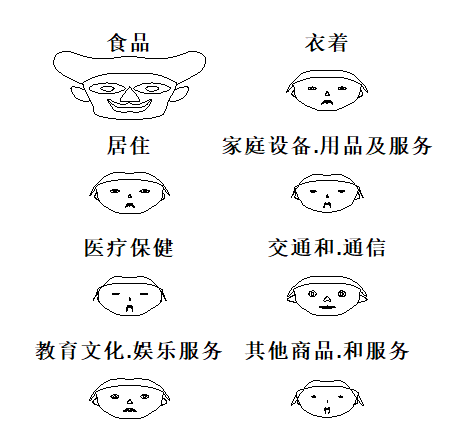
> faces(income_matrix,nrow.plot = 4,ncol.plot = 2,face.type = 0)
effect of variables:
modified item Var
"height of face " "食品"
"width of face " "衣着"
"structure of face" "居住"
"height of mouth " "家庭设备.用品及服务"
"width of mouth " "医疗保健"
"smiling " "交通和.通信"
"height of eyes " "教育文化.娱乐服务"
"width of eyes " "其他商品.和服务"
"height of hair " "食品"
"width of hair " "衣着"
"style of hair " "居住"
"height of nose " "家庭设备.用品及服务"
"width of nose " "医疗保健"
"width of ear " "交通和.通信"
"height of ear " "教育文化.娱乐服务"
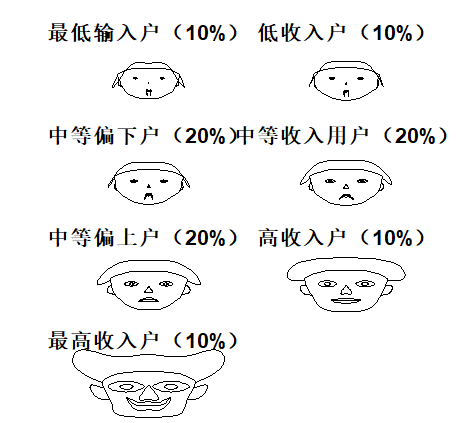
不同消费项目的脸谱图
> faces(t(income_matrix),nrow.plot = 4,ncol.plot = 2,face.type = 0)
effect of variables:
 modified item       Var
 "height of face   " "最低输入户(10%)"
 "width of face    " "低收入户(10%)"
 "structure of face" "中等偏下户(20%)"
 "height of mouth  " "中等收入用户(20%)"
 "width of mouth   " "中等偏上户(20%)"
 "smiling          " "高收入户(10%)"
 "height of eyes   " "最高收入户(10%)"
 "width of eyes    " "最低输入户(10%)"
 "height of hair   " "低收入户(10%)"
 "width of hair   "  "中等偏下户(20%)"
 "style of hair   "  "中等收入用户(20%)"
 "height of nose  "  "中等偏上户(20%)"
 "width of nose   "  "高收入户(10%)"
 "width of ear    "  "最高收入户(10%)"
 "height of ear   "  "最低输入户(10%)"
