

一:安装插件
1.1 下载mysqld_exporter
mysqld_exporter 是一个用于监控 MySQL 服务器的开源工具,它是由 Prometheus 社区维护的一个官方 Exporter。该工具通过连接到 MySQL 服务器并执行各种查询来
收集关于 MySQL 服务器性能和状态的指标,并将这些指标暴露给 Prometheus 监控系统。
在https://github.com/prometheus/mysqld_exporter/releases/tag/v0.15.1 下载mysqld_exporter-0.15.1.linux-amd64.tar.gz安装包
1.2 安装mysqld_exporter
将mysqld_exporter-0.15.1.linux-amd64.tar.gz安装包上传到mysqlf服务器/usr/local 目录下

[root@rancher local]# tar xvf mysqld_exporter-0.15.1.linux-amd64.tar.gz
[root@rancher local]# mv mysqld_exporter-0.15.1.linux-amd64 mysqld_exporter
[root@rancher local]# cd mysqld_exporter/
[root@rancher mysqld_exporter]# vim .my.conf   ##配置数据库连接密码
[client]
user=root
password=Root

[root@rancher mysqld_exporter]# vim /usr/lib/systemd/system/mysqld_exporter.service    ##配置systemctl 启动
[Unit]
Description=mysqld_exporter
After=network.target
[Service]
User=root
Type=simple
ExecStart=/usr/local/mysqld_exporter/mysqld_exporter --config.my-cnf=/usr/local/mysqld_exporter/.my.conf --collect.info_schema.processlist --web.listen-address=0.0.0.0:9104
Restart=on-failure
[Install]
WantedBy=multi-user.target
[root@rancher mysqld_exporter]# systemctl start mysqld_exporter.service     ##启动mysqld_exporter服务
[root@rancher mysqld_exporter]# systemctl enable mysqld_exporter.service    ##配置mysqld_exporter开机自启
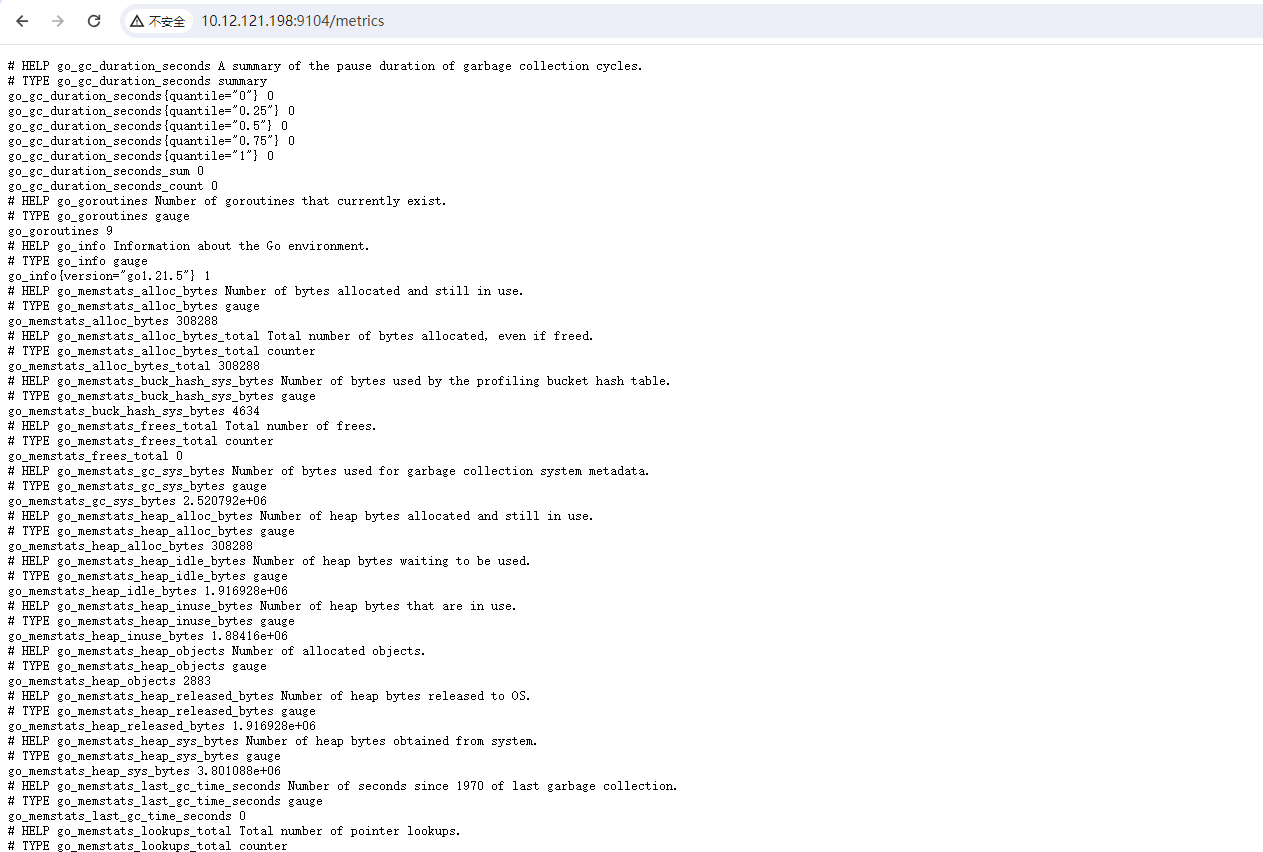
使用浏览器访问http://10.12.121.198:9104/metrics 就能看到数据了
1.3 prometheus添加配置
[root@rancher mysqld_exporter]# cd /data/prometheus/
[root@rancher prometheus]# vim prometheus.yml   ## job_name 后面添加
  - job_name: 'mysqld'
    static_configs:
      - targets: ["10.12.121.198:9104"]
    relabel_configs:
    - source_labels: [__address__]
      regex: "([^:]+):\\d+"
      target_label: instance
[root@rancher prometheus]# systemctl reload prometheus ##重新加载配置文件
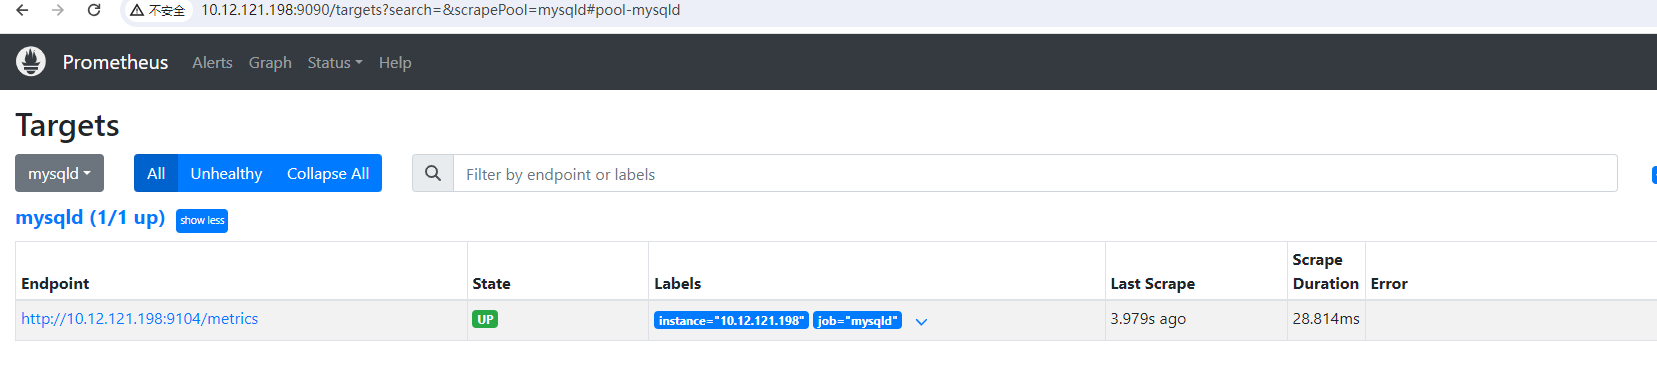
1 | 访问http://10.12.121.198:9090/targets?search=&scrapePool=mysqld#pool-mysqld 查看,这样就成功了 |
1.4 配置prometheus告警规则
[root@rancher rules]# cd /data/prometheus/rules/      ##进入规则配置目录
[root@rancher rules]# vim mysql_rules.yml
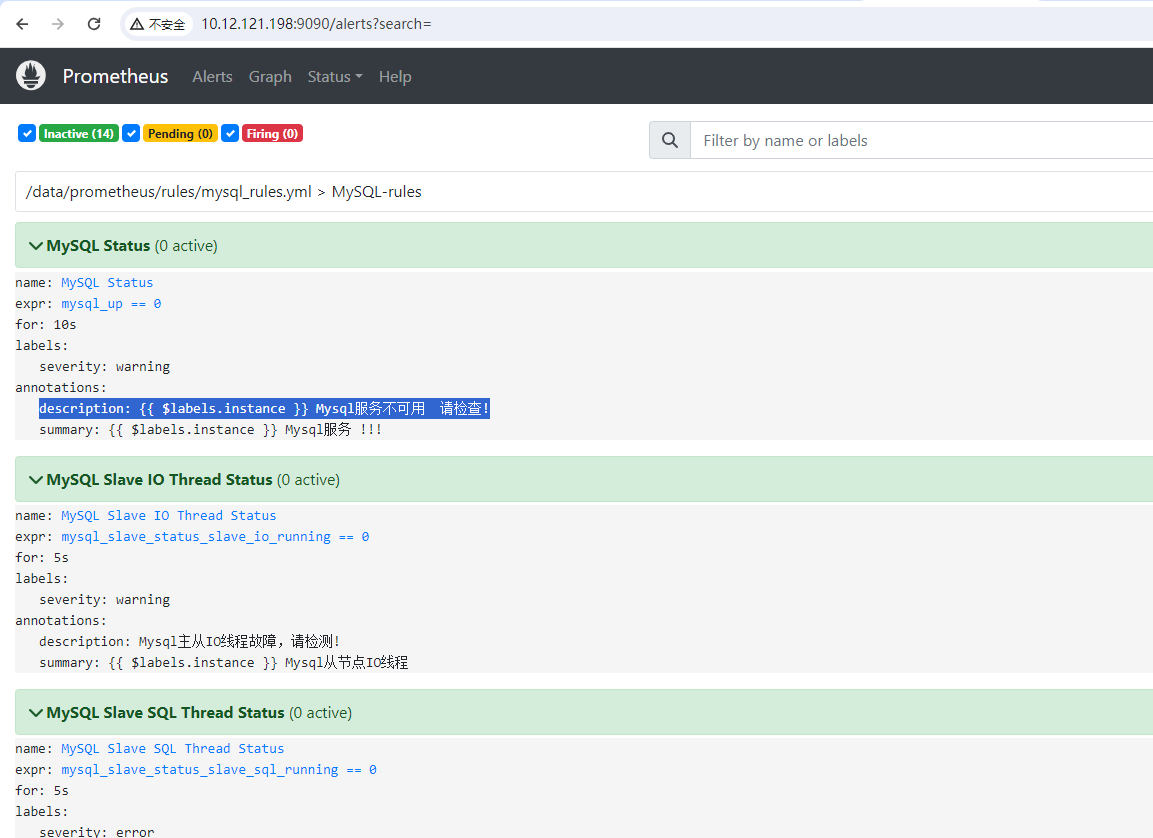
groups:
- name: MySQL-rules
  rules:
#mysql状态检测
  - alert: MySQL Status
    expr: mysql_up == 0
    for: 10s
    labels:
      severity: warning
    annotations:
      summary: "{{ $labels.instance }} Mysql服务 !!!"
      description: "{{ $labels.instance }} Mysql服务不可用  请检查!"

#mysql主从IO线程停止时触发告警
  - alert: MySQL Slave IO Thread Status
    expr: mysql_slave_status_slave_io_running == 0
    for: 5s
    labels:
      severity: warning
    annotations:
      summary: "{{ $labels.instance }} Mysql从节点IO线程"
      description: "Mysql主从IO线程故障,请检测!"

#mysql主从sql线程停止时触发告警
  - alert: MySQL Slave SQL Thread Status
    expr: mysql_slave_status_slave_sql_running == 0
    for: 5s
    labels:
      severity: error
    annotations:
      summary: "{{$labels.instance}}: MySQL Slave SQL Thread has stop !!!"
      description: "检测MySQL主从SQL线程运行状态"

#mysql主从延时状态告警
  - alert: MySQL Slave Delay Status
    expr: mysql_slave_status_sql_delay == 30
    for: 5s
    labels:
      severity: warning
    annotations:
      summary: "{{$labels.instance}}: MySQL 主从延迟超过 30s !!!"
      description: "检测MySQL主从延时状态"

#mysql连接数告警
  - alert: Mysql_Too_Many_Connections
    expr: rate(mysql_global_status_threads_connected[5m]) > 200
    for: 2m
    labels:
      severity: warning
    annotations:
      summary: "{{$labels.instance}}: 连接数过多"
      description: "{{$labels.instance}}: 连接数过多,请处理 ,(current value is: {{ $value }})!"

 #mysql慢查询有点多告警
  - alert: Mysql_Too_Many_slow_queries
    expr: rate(mysql_global_status_slow_queries[5m]) > 3
    for: 2m
    labels:
      severity: warning
    annotations:
      summary: "{{$labels.instance}}: 慢查询有点多,请检查处理!"
      description: "{{$labels.instance}}: Mysql slow_queries is more than 3 per second ,(current value is: {{ $value }})"
[root@rancher rules]# systemctl reload prometheus.service ##重新加载配置文件
到prometheus web 界面查看告警规则
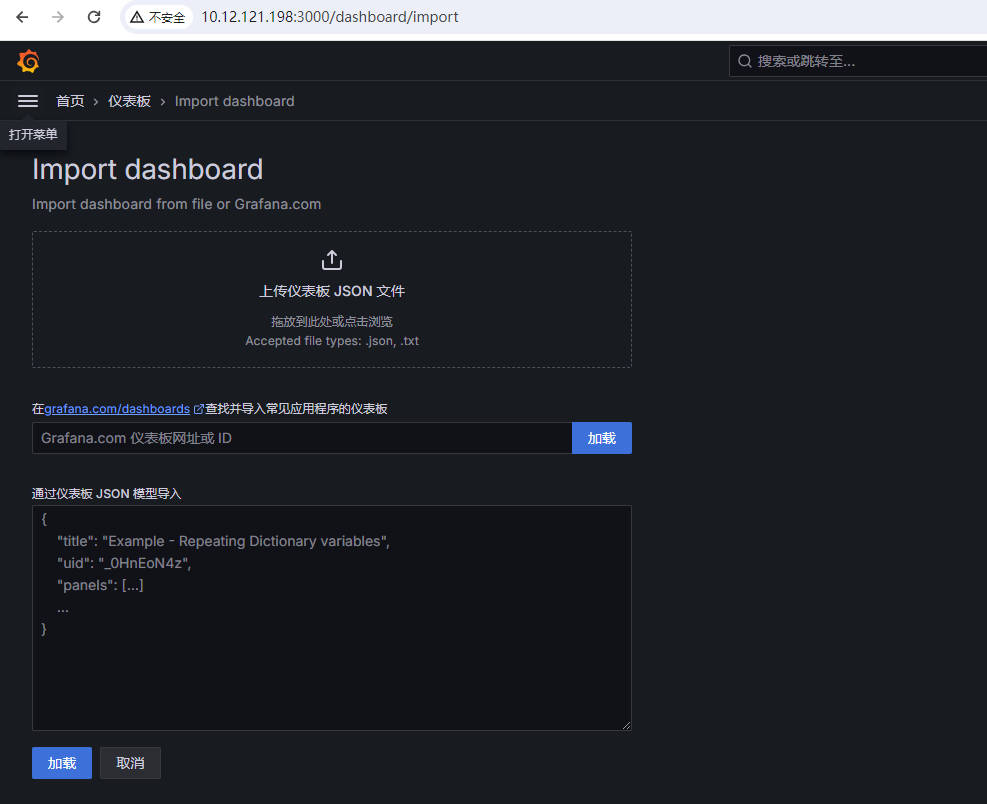
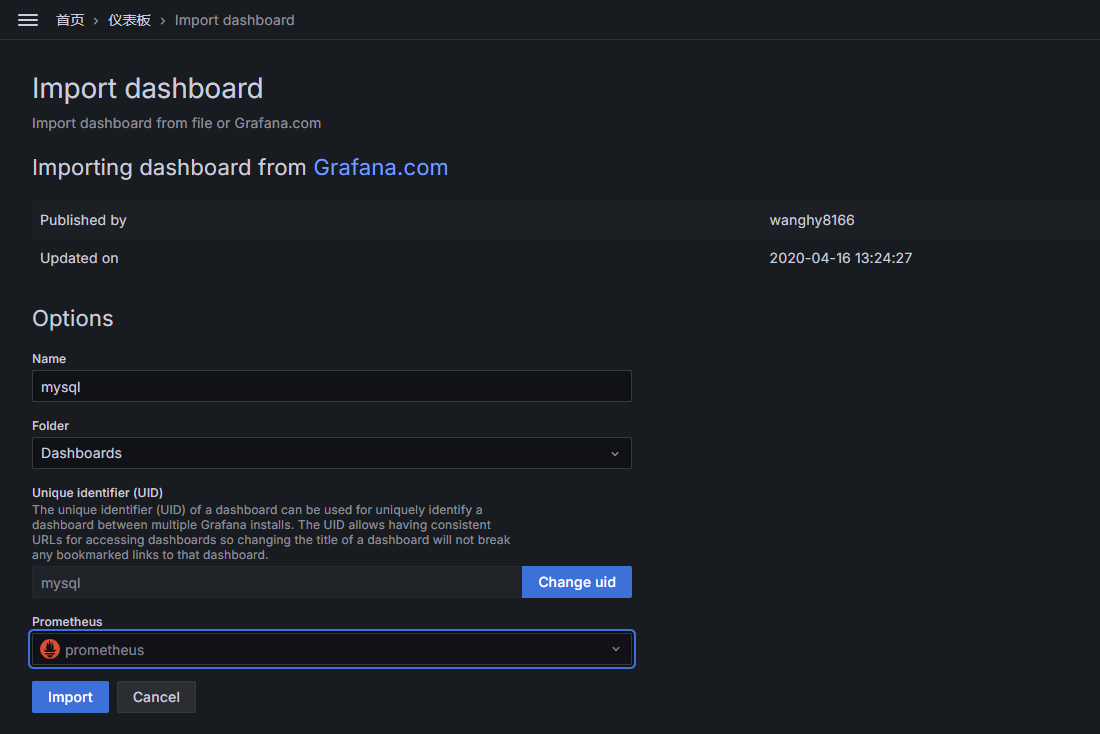
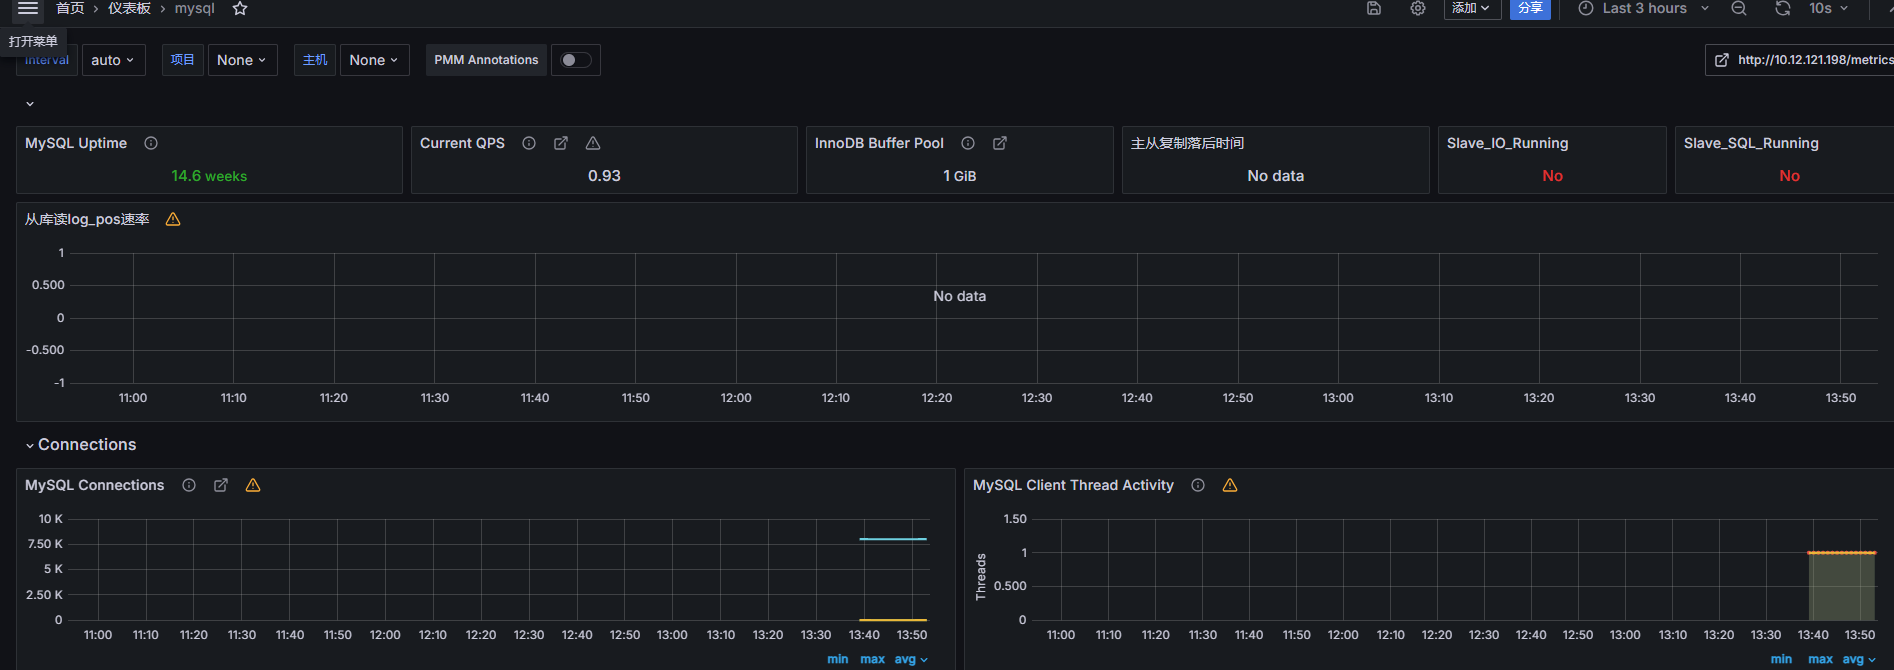
1.5 配置granfan看板
登陆granfan web管理界面
仪表板——导入——选择11323 模版
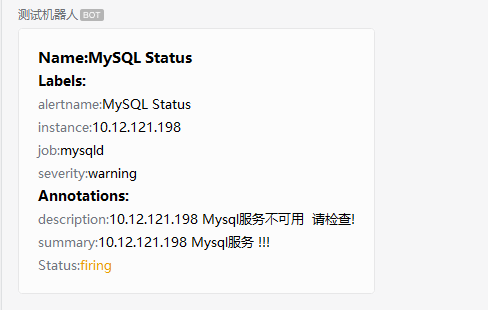
告警成功图


【推荐】国内首个AI IDE,深度理解中文开发场景,立即下载体验Trae
【推荐】编程新体验,更懂你的AI,立即体验豆包MarsCode编程助手
【推荐】抖音旗下AI助手豆包,你的智能百科全书,全免费不限次数
【推荐】轻量又高性能的 SSH 工具 IShell:AI 加持,快人一步
· TypeScript + Deepseek 打造卜卦网站:技术与玄学的结合
· Manus的开源复刻OpenManus初探
· AI 智能体引爆开源社区「GitHub 热点速览」
· 从HTTP原因短语缺失研究HTTP/2和HTTP/3的设计差异
· 三行代码完成国际化适配,妙~啊~