1.前言
var data = [
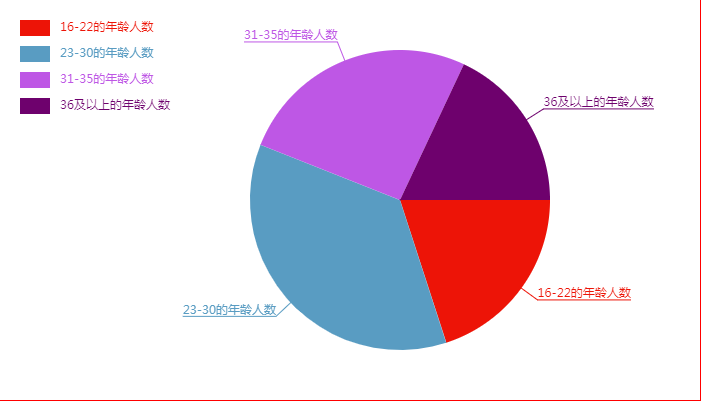
{value:"10",title:"16-22的年龄人数"},
{value:"15",title:"23-30的年龄人数"},
{value:"25",title:"31-35的年龄人数"},
{value:"10",title:"36及以上的年龄人数"}
]
2.代码
- 实例化传入dom,内部变量初始化
- 调用渲染方法,传入数据
- 接收传入的数据,进行初始化(区间占比,起始角度,结束角度,颜色)
- 渲染扇形模块
- 渲染图例模块
- 渲染延长线和文字模块
<script>
var PieChart = function(dom) {
this.init(dom)
}
PieChart.prototype.init = function(dom){
var dom = dom || document.querySelector('canvas')
this.ctx = dom && dom.getContext("2d")
this.w = this.ctx.canvas.width
this.h = this.ctx.canvas.height
this.x0 = this.w / 2
this.y0 = this.h / 2
this.r = 150
this.outLineWidth = this.r + 20
this.legend_width = 30
this.legend_height = 16
this.legend_space = 10
this.ctx.textAlign = 'left'
this.ctx.font = '12px 微软雅黑'
}
PieChart.prototype.render = function(data = []){
this._data = JSON.parse(JSON.stringify(data))
this.data = JSON.parse(JSON.stringify(data))
this.dataInit()
this.drawSector()
this.drawLegend()
this.drawText()
}
PieChart.prototype.getRandomColor = function() {
var r = Math.round(Math.random() * 255)
var g = Math.round(Math.random() * 255)
var b = Math.round(Math.random() * 255)
return 'rgb(' + r + ',' + g + ',' + b + ')'
}
PieChart.prototype.dataInit = function() {
var total = data.reduce((total,item) => {
return total + Number(item.value)
},0)
var startRadian = 0
var endRadian = 0
for(var i=0;i<this.data.length;i++){
var proportion = this.data[i].value/total
var radian = Math.PI * 2 * proportion
startRadian = endRadian
endRadian = startRadian + radian
var color = this.getRandomColor()
this.data[i].proportion = proportion
this.data[i].radian = radian
this.data[i].startRadian = startRadian
this.data[i].endRadian = endRadian
this.data[i].color = color
}
}
PieChart.prototype.drawSector = function(){
for(var i=0;i<this.data.length;i++){
var section_data = this.data[i]
this.ctx.beginPath()
this.ctx.fillStyle = this.data[i].color
this.ctx.arc(this.x0, this.y0, this.r, section_data.startRadian, section_data.endRadian)
this.ctx.lineTo(this.x0, this.y0)
this.ctx.fill()
}
}
PieChart.prototype.drawLegend = function(){
this.ctx.textBaseline = 'middle'
var item_center_y = -this.legend_height
for(var i=0;i<this.data.length;i++){
this.ctx.beginPath()
this.ctx.fillStyle = this.data[i].color
var title = this.data[i].title
item_center_y += (this.legend_space + this.legend_height)
this.ctx.fillRect(this.legend_space, item_center_y, this.legend_width, this.legend_height)
this.ctx.fillText(title, this.legend_space + this.legend_width + 10, item_center_y + this.legend_height/2)
}
this.ctx.textBaseline = 'baseline'
}
PieChart.prototype.drawText = function(){
this.ctx.textBaseline = 'bottom'
for(var i=0;i<this.data.length;i++){
var section_data = this.data[i]
var title = section_data.title
var middleRadian = (section_data.startRadian + section_data.endRadian) / 2
var outX = this.x0 + this.outLineWidth * Math.cos(middleRadian)
var outY = this.y0 + this.outLineWidth * Math.sin(middleRadian)
if (outX >= this.x0) {
var underlineX = outX + this.ctx.measureText(title).width
this.ctx.textAlign = 'left'
} else {
var underlineX = outX - this.ctx.measureText(title).width
this.ctx.textAlign = 'right'
}
this.ctx.beginPath()
this.ctx.strokeStyle = this.data[i].color
this.ctx.fillStyle = this.data[i].color
this.ctx.moveTo(this.x0, this.y0)
this.ctx.lineTo(outX, outY)
this.ctx.lineTo(underlineX, outY)
this.ctx.stroke()
this.ctx.beginPath()
this.ctx.fillText(title, outX, outY)
}
this.ctx.textBaseline = 'baseline'
}
</script>
3.调用
<script>
var box = document.querySelector("canvas")
var data = [
{value:0,title:"16-22的年龄人数"},
{value:0,title:"23-30的年龄人数"},
{value:0,title:"31-35的年龄人数"},
{value:0,title:"36及以上的年龄人数"}
]
var num = 50
for(var i=0;i<num;i++){
var age = Math.floor(16 + Math.random()*25)
if(age < 23){
data[0].value++
}else if(age < 31){
data[1].value++
}else if(age < 36){
data[2].value++
}else{
data[3].value++
}
}
var pieChart = new PieChart(box)
pieChart.render(data)
</script>
4.效果图
5.ES6类语法
<script>
class PieChart{
constructor(dom){
this.init(dom)
}
init(dom){
var dom = dom || document.querySelector('canvas')
this.ctx = dom && dom.getContext("2d")
this.w = this.ctx.canvas.width
this.h = this.ctx.canvas.height
this.x0 = this.w / 2
this.y0 = this.h / 2
this.r = 150
this.outLineWidth = this.r + 20
this.legend_width = 30
this.legend_height = 16
this.legend_space = 10
this.ctx.textAlign = 'left'
this.ctx.font = '12px 微软雅黑'
}
render(data = []){
this._data = JSON.parse(JSON.stringify(data))
this.data = JSON.parse(JSON.stringify(data))
this.dataInit()
this.drawSector()
this.drawLegend()
this.drawText()
}
getRandomColor() {
var r = Math.round(Math.random() * 255)
var g = Math.round(Math.random() * 255)
var b = Math.round(Math.random() * 255)
return 'rgb(' + r + ',' + g + ',' + b + ')'
}
dataInit() {
var total = data.reduce((total,item) => {
return total + Number(item.value)
},0)
var startRadian = 0
var endRadian = 0
for(var i=0;i<this.data.length;i++){
var proportion = this.data[i].value/total
var radian = Math.PI * 2 * proportion
startRadian = endRadian
endRadian = startRadian + radian
var color = this.getRandomColor()
this.data[i].proportion = proportion
this.data[i].radian = radian
this.data[i].startRadian = startRadian
this.data[i].endRadian = endRadian
this.data[i].color = color
}
}
drawSector(){
for(var i=0;i<this.data.length;i++){
var section_data = this.data[i]
this.ctx.beginPath()
this.ctx.fillStyle = this.data[i].color
this.ctx.arc(this.x0, this.y0, this.r, section_data.startRadian, section_data.endRadian)
this.ctx.lineTo(this.x0, this.y0)
this.ctx.fill()
}
}
drawLegend(){
this.ctx.textBaseline = 'middle'
var item_center_y = -this.legend_height
for(var i=0;i<this.data.length;i++){
this.ctx.beginPath()
this.ctx.fillStyle = this.data[i].color
var title = this.data[i].title
item_center_y += (this.legend_space + this.legend_height)
this.ctx.fillRect(this.legend_space, item_center_y, this.legend_width, this.legend_height)
this.ctx.fillText(title, this.legend_space + this.legend_width + 10, item_center_y + this.legend_height/2)
}
this.ctx.textBaseline = 'baseline'
}
drawText(){
this.ctx.textBaseline = 'bottom'
for(var i=0;i<this.data.length;i++){
var section_data = this.data[i]
var title = section_data.title
var middleRadian = (section_data.startRadian + section_data.endRadian) / 2
var outX = this.x0 + this.outLineWidth * Math.cos(middleRadian)
var outY = this.y0 + this.outLineWidth * Math.sin(middleRadian)
if (outX >= this.x0) {
var underlineX = outX + this.ctx.measureText(title).width
this.ctx.textAlign = 'left'
} else {
var underlineX = outX - this.ctx.measureText(title).width
this.ctx.textAlign = 'right'
}
this.ctx.beginPath()
this.ctx.strokeStyle = this.data[i].color
this.ctx.fillStyle = this.data[i].color
this.ctx.moveTo(this.x0, this.y0)
this.ctx.lineTo(outX, outY)
this.ctx.lineTo(underlineX, outY)
this.ctx.stroke()
this.ctx.beginPath()
this.ctx.fillText(title, outX, outY)
}
this.ctx.textBaseline = 'baseline'
}
}
</script>


【推荐】国内首个AI IDE,深度理解中文开发场景,立即下载体验Trae
【推荐】编程新体验,更懂你的AI,立即体验豆包MarsCode编程助手
【推荐】抖音旗下AI助手豆包,你的智能百科全书,全免费不限次数
【推荐】轻量又高性能的 SSH 工具 IShell:AI 加持,快人一步
· 基于Microsoft.Extensions.AI核心库实现RAG应用
· Linux系列:如何用heaptrack跟踪.NET程序的非托管内存泄露
· 开发者必知的日志记录最佳实践
· SQL Server 2025 AI相关能力初探
· Linux系列:如何用 C#调用 C方法造成内存泄露
· Manus爆火,是硬核还是营销?
· 终于写完轮子一部分:tcp代理 了,记录一下
· 别再用vector<bool>了!Google高级工程师:这可能是STL最大的设计失误
· 单元测试从入门到精通
· 震惊!C++程序真的从main开始吗?99%的程序员都答错了