1-Elasticsearch - elk收集各种日志
about
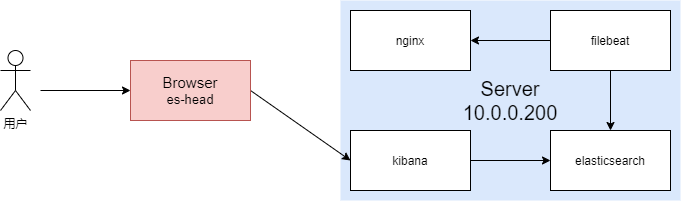
centos7.9 + elasticsearch-6.8.15 + kibana-6.8.15 + filebeat-6.8.15 + elasticserach-head-chrome
https://www.elastic.co/cn/beats/filebeat
https://www.elastic.co/guide/en/beats/filebeat/6.8/filebeat-overview.html
https://www.cnblogs.com/zsql/p/13137833.html
这里先来介绍下filebeat:
- 简单来说,filebeat是Bests中的一员,专门用于收集指定文件或位置的文本类型的收集工具。
- 它将收集的内容发送到指定es服务器进行存储,后续我们可以通过kibana对这些数据进行分析。
后续的各种演示,大家一定要注意区分当前操作的是哪个服务器。
filebeat简单收集nginx日志
一台服务器上演示filebeat收集nginx日志
filebeat收集普通的nginx日志
filebeat收集普通的nginx日志
首先再次确认相关文件位置:
/var/log/nginx/access.log  # nginx 日志文件
/etc/filebeat/filebeat.yml  # filebeat 主配置文件
然后,我们编辑filebeat的配置文件:
filebeat.inputs:

- type: log
  # 打开日志收集功能
  enabled: true
  # 要收集的日志路径
  paths:
    - /var/log/nginx/access.log

output.elasticsearch:
  # 输出到指定es
  hosts: ["10.0.0.200:9200"]
简单的收集nginx日志,就这些配置,其他保持默认即可,注意yml文件的格式啊。
然后启动filebeat:
# 此时我的filebeat配置
[root@cs tmp]# egrep -v "#|^$" /etc/filebeat/filebeat.yml
filebeat.inputs:
- type: log
  enabled: true
  paths:
    - /var/log/nginx/access.log
filebeat.config.modules:
  path: ${path.config}/modules.d/*.yml
  reload.enabled: false
setup.template.settings:
  index.number_of_shards: 3
setup.kibana:
output.elasticsearch:
  hosts: ["10.0.0.200:9200"]
processors:
  - add_host_metadata: ~
  - add_cloud_metadata: ~

[root@cs tmp]# systemctl start filebeat
[root@cs tmp]# tail -f /var/log/filebeat/filebeat
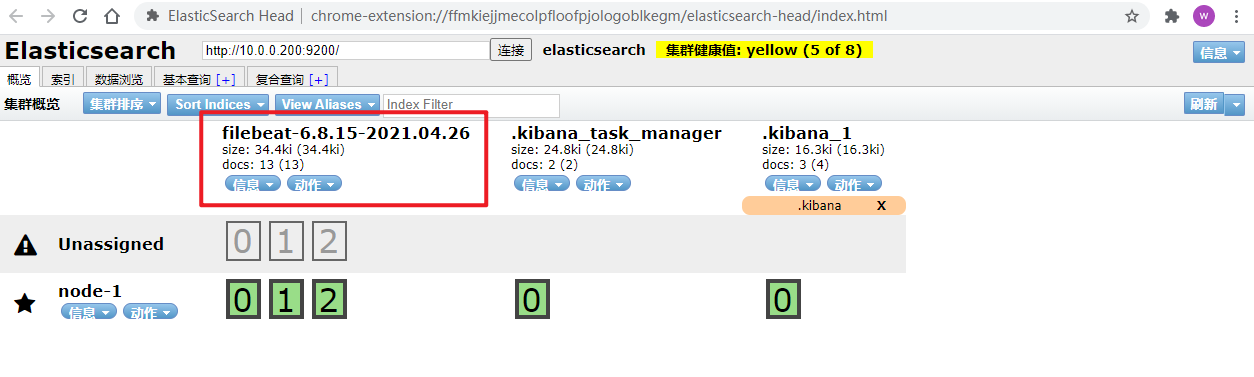
当filebeat启动完成,它会自动的收集nginx日志,然后发送到es,es会根据filebeat的模板(先忽略这个东西),自动创建索引,这个索引名由filebeat版本号加当前日期组成。
然后,elasticsearch-head中就可以查看到了:
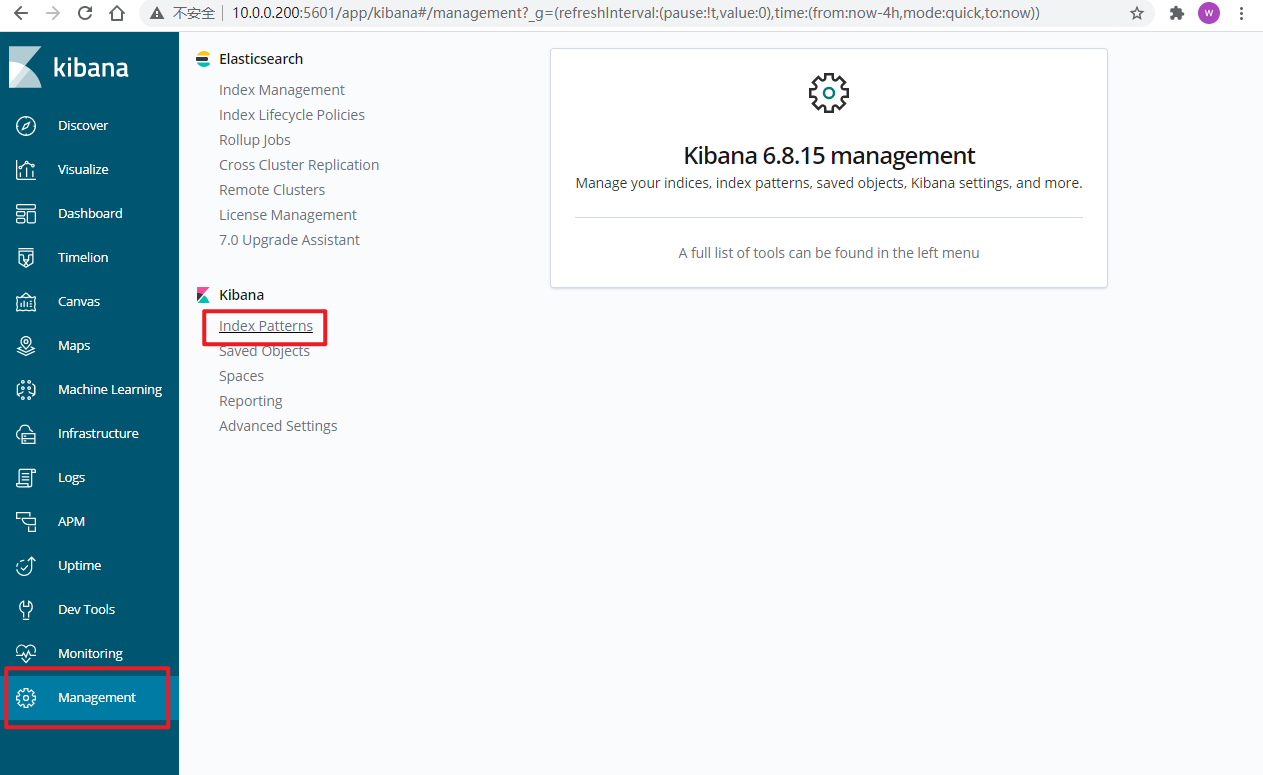
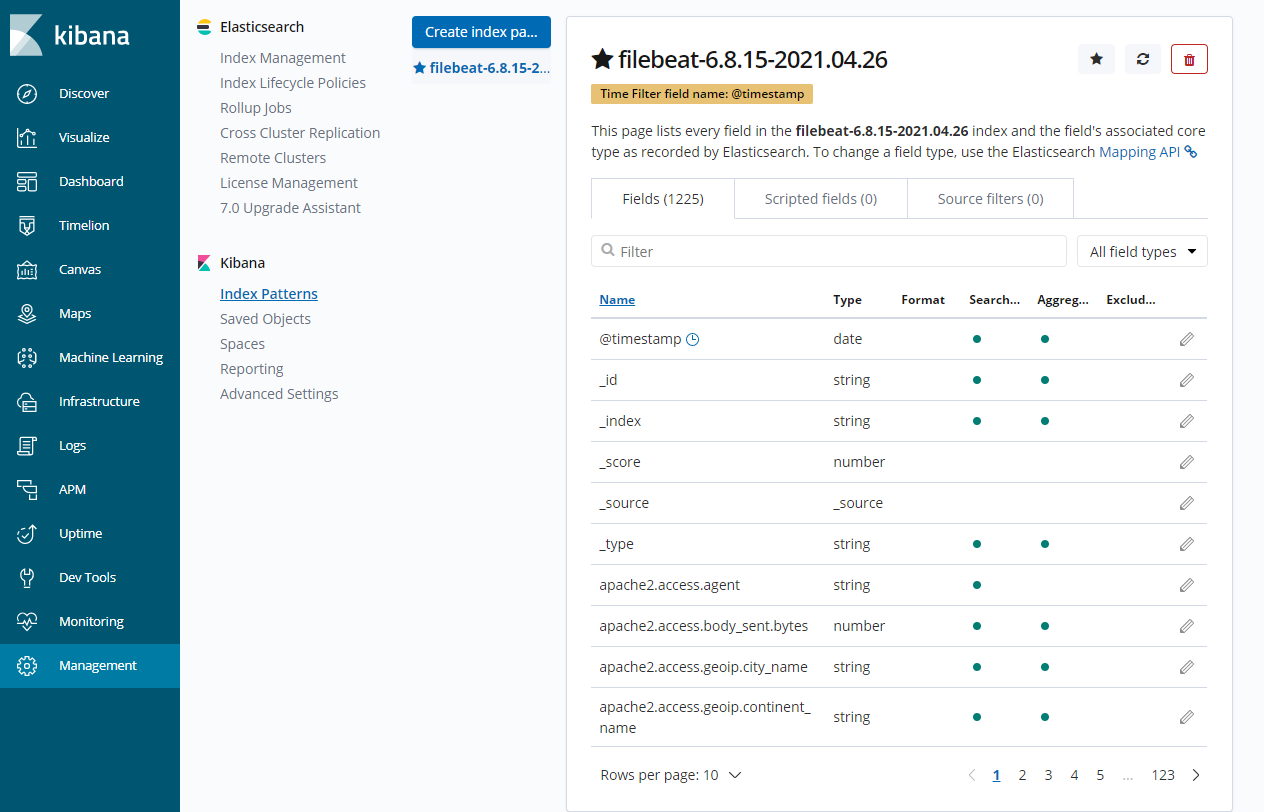
完事之后,就要在kibana中配置了:
- 添加索引,找到es为filebeat创建索引,一般kibana会自动提示,你把它放到输入框中:

- 继续配置,按下图操作:

配置好之后,长这样:

- 在discover栏,就可以看到图标及日志信息了,在这个页面也可以进行一些其他的配置。
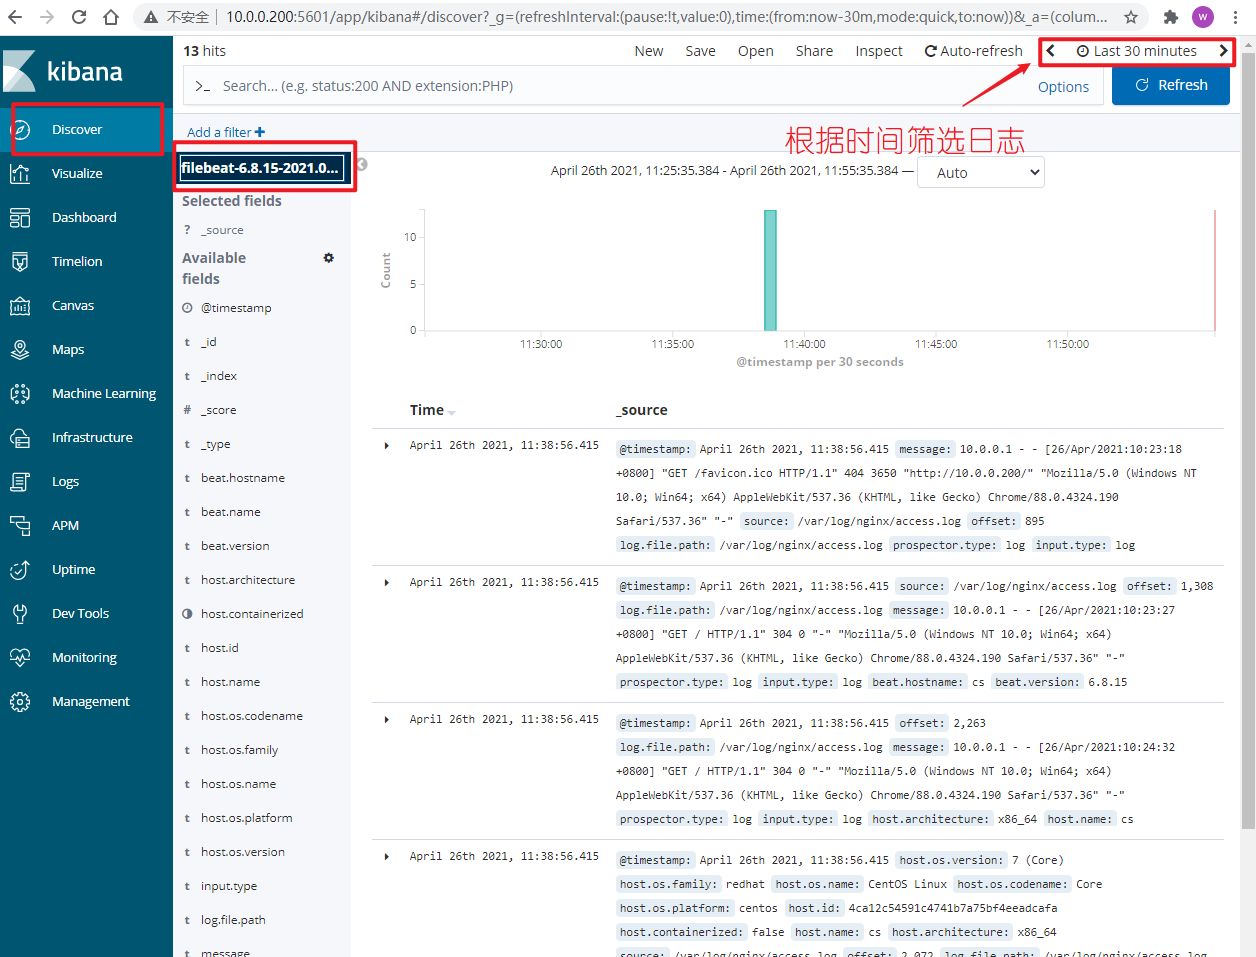
虽然,效果出来了,但是问题也很明显,每一条nginx日志,都被当作一个文本存到了es中,这样不太便于后期的搜索。
解决方案也是有的,那就是将nginx日志存储为json类型,然后es的索引中,每一个文档都是k:v格式的,那就比较好查找和过滤了。
filebeat收集json格式的nginx日志
上面也说了,普通的一条nginx日志被当作一条:
# 普通nginx日志
10.0.0.1 - - [26/Apr/2021:10:24:32 +0800] "GET / HTTP/1.1" 304 0 "-" "Mozilla/5.0 (Windows NT 10.0; Win64; x64) AppleWebKit/537.36 (KHTML, like Gecko) Chrome/88.0.4324.190 Safari/537.36" "-"

# 期望的json格式的nginx日志,因为后续更好分析和处理
{"time_local": "26/Apr/2021:16:57:33 +0800","remote_addr": "10.0.0.200","referer": "-","request": "GET /home.html HTTP/1.0","status": "404","bytes": "3650","agent": "ApacheBench/2.3","x_forwarded": "-","up_addr": "-","up_host": "-","upstream_time": "-","request_time": "0.000"}
那怎么搞呢?
filebeat收集json格式的nginx日志
这里需要重新对各个环境进行配置。
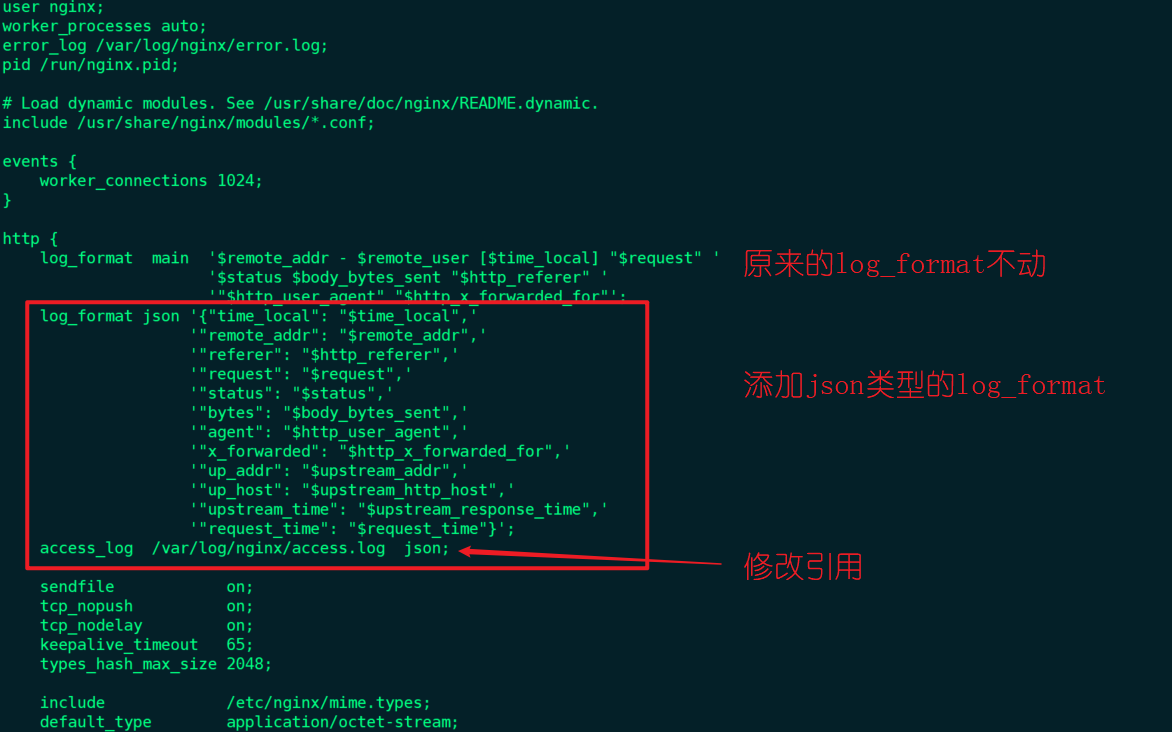
- 修改nginx配置,使其生成的每条日志都是json格式的:
[root@cs ~]# vim /etc/nginx/nginx.conf
[root@cs ~]# cat /etc/nginx/nginx.conf
# For more information on configuration, see:
#   * Official English Documentation: http://nginx.org/en/docs/
#   * Official Russian Documentation: http://nginx.org/ru/docs/

user nginx;
worker_processes auto;
error_log /var/log/nginx/error.log;
pid /run/nginx.pid;

# Load dynamic modules. See /usr/share/doc/nginx/README.dynamic.
include /usr/share/nginx/modules/*.conf;

events {
    worker_connections 1024;
}

http {
    log_format  main  '$remote_addr - $remote_user [$time_local] "$request" '
                      '$status $body_bytes_sent "$http_referer" '
                      '"$http_user_agent" "$http_x_forwarded_for"';
    log_format json '{"time_local": "$time_local",'
		    '"remote_addr": "$remote_addr",'
		    '"referer": "$http_referer",'
		    '"request": "$request",'
	            '"status": "$status",'
		    '"bytes": "$body_bytes_sent",'
		    '"agent": "$http_user_agent",'
		    '"x_forwarded": "$http_x_forwarded_for",'
		    '"up_addr": "$upstream_addr",'
		    '"up_host": "$upstream_http_host",'
		    '"upstream_time": "$upstream_response_time",'
		    '"request_time": "$request_time"}';
    access_log  /var/log/nginx/access.log  json;

    sendfile            on;
    tcp_nopush          on;
    tcp_nodelay         on;
    keepalive_timeout   65;
    types_hash_max_size 2048;

    include             /etc/nginx/mime.types;
    default_type        application/octet-stream;

    # Load modular configuration files from the /etc/nginx/conf.d directory.
    # See http://nginx.org/en/docs/ngx_core_module.html#include
    # for more information.
    include /etc/nginx/conf.d/*.conf;

    server {
        listen       80 default_server;
        listen       [::]:80 default_server;
        server_name  _;
        root         /usr/share/nginx/html;

        # Load configuration files for the default server block.
        include /etc/nginx/default.d/*.conf;

        location / {
        }

        error_page 404 /404.html;
        location = /404.html {
        }

        error_page 500 502 503 504 /50x.html;
        location = /50x.html {
        }
    }

# 很重要的一步,nginx -t 检测配置正确性也没有问题
[root@cs ~]# nginx -t
nginx: the configuration file /etc/nginx/nginx.conf syntax is ok
nginx: configuration file /etc/nginx/nginx.conf test is successful
然后再清空原nginx日志:
[root@cs ~]# > /var/log/nginx/access.log
[root@cs ~]# systemctl reload nginx
[root@cs ~]# lsof -i:80
COMMAND  PID  USER   FD   TYPE DEVICE SIZE/OFF NODE NAME
nginx   1767  root    6u  IPv4  26111      0t0  TCP *:http (LISTEN)
nginx   1767  root    7u  IPv6  26112      0t0  TCP *:http (LISTEN)
nginx   2135 nginx    6u  IPv4  26111      0t0  TCP *:http (LISTEN)
nginx   2135 nginx    7u  IPv6  26112      0t0  TCP *:http (LISTEN)
nginx   2136 nginx    6u  IPv4  26111      0t0  TCP *:http (LISTEN)
nginx   2136 nginx    7u  IPv6  26112      0t0  TCP *:http (LISTEN)
nginx   2137 nginx    6u  IPv4  26111      0t0  TCP *:http (LISTEN)
nginx   2137 nginx    7u  IPv6  26112      0t0  TCP *:http (LISTEN)
nginx   2138 nginx    6u  IPv4  26111      0t0  TCP *:http (LISTEN)
nginx   2138 nginx    7u  IPv6  26112      0t0  TCP *:http (LISTEN)
ok了,nginx这边暂时没问题了。
- 修改filebeat配置文件:
[root@cs ~]# vim /etc/filebeat/filebeat.yml

  # 就多了两行这个,意思是filebeat将日志解析为json格式后,再传给es
  json.keys_under_root: true
  json.overwrite_keys: true

# 修改后的配置文件长这样:
[root@cs ~]# egrep -v "#|^$" /etc/filebeat/filebeat.yml
filebeat.inputs:
- type: log
  enabled: true
  paths:
    - /var/log/nginx/access.log
  json.keys_under_root: true
  json.overwrite_keys: true
filebeat.config.modules:
  path: ${path.config}/modules.d/*.yml
  reload.enabled: false
setup.template.settings:
  index.number_of_shards: 3
setup.kibana:
output.elasticsearch:
  hosts: ["10.0.0.200:9200"]
processors:
  - add_host_metadata: ~
  - add_cloud_metadata: ~
完事之后重启filebeat:
[root@cs ~]# systemctl restart filebeat
[root@cs ~]# tail -f /var/log/filebeat/filebeat
2021-04-26T15:17:31.681+0800	INFO	instance/beat.go:402	filebeat start running.
2021-04-26T15:17:31.681+0800	INFO	registrar/registrar.go:134	Loading registrar data from /var/lib/filebeat/registry
2021-04-26T15:17:31.684+0800	INFO	registrar/registrar.go:141	States Loaded from registrar: 1
2021-04-26T15:17:31.684+0800	INFO	crawler/crawler.go:72	Loading Inputs: 1
2021-04-26T15:17:31.685+0800	INFO	log/input.go:148	Configured paths: [/var/log/nginx/access.log]
2021-04-26T15:17:31.685+0800	INFO	input/input.go:114	Starting input of type: log; ID: 15383831961883387157
2021-04-26T15:17:31.685+0800	INFO	crawler/crawler.go:106	Loading and starting Inputs completed. Enabled inputs: 1
2021-04-26T15:17:31.685+0800	INFO	cfgfile/reload.go:150	Config reloader started
2021-04-26T15:17:31.685+0800	INFO	cfgfile/reload.go:205	Loading of config files completed.
2021-04-26T15:17:34.682+0800	INFO	add_cloud_metadata/add_cloud_metadata.go:340	add_cloud_metadata: hosting provider type not detected.
2021-04-26T15:18:01.687+0800	INFO	[monitoring]	log/log.go:144	Non-zero metrics in the last 30s	{"monitoring": {"metrics": {"beat":{"cpu":{"system":{"ticks":20,"time":{"ms":29}},"total":{"ticks":40,"time":{"ms":56},"value":40},"user":{"ticks":20,"time":{"ms":27}}},"handles":{"limit":{"hard":4096,"soft":1024},"open":6},"info":{"ephemeral_id":"590ebcbe-4e28-4c3e-bd9d-01e2e1a9aa41","uptime":{"ms":30022}},"memstats":{"gc_next":4353952,"memory_alloc":2232424,"memory_total":5052440,"rss":17850368}},"filebeat":{"events":{"added":1,"done":1},"harvester":{"open_files":0,"running":0}},"libbeat":{"config":{"module":{"running":0},"reloads":1},"output":{"type":"elasticsearch"},"pipeline":{"clients":1,"events":{"active":0,"filtered":1,"total":1}}},"registrar":{"states":{"current":1,"update":1},"writes":{"success":1,"total":1}},"system":{"cpu":{"cores":4},"load":{"1":0.01,"15":0.05,"5":0.02,"norm":{"1":0.0025,"15":0.0125,"5":0.005}}}}}}
但注意,此时并没有nginx日志产生,就算产生了也没事。
另外,如果要收集的是多个服务器上的nginx日志,那么上面的操作要同步到所有服务器,保证数据格式的一致性。
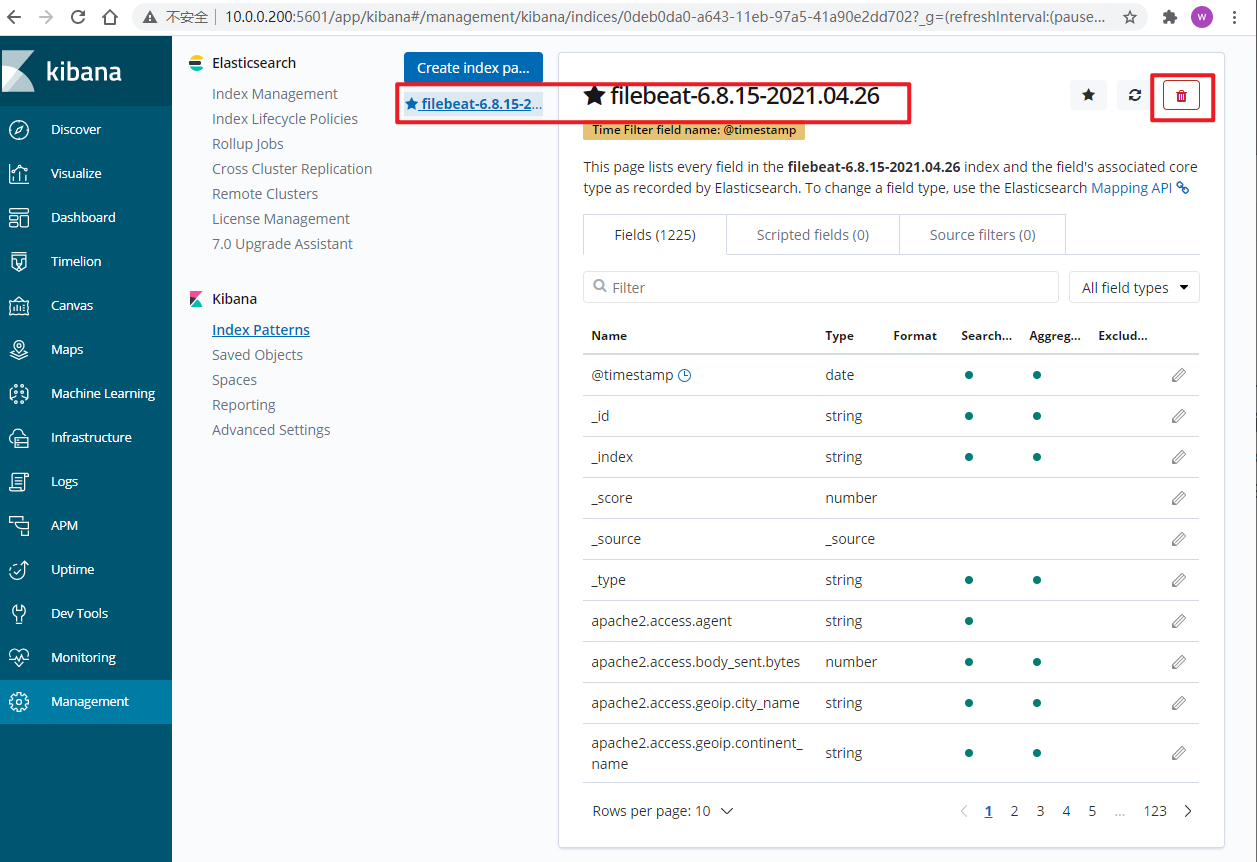
- kibana操作,由于原数据集由普通文本转换为json格式的文本,那么es中的相应索引存储的数据也要删除,这里直接删除索引即可。让后续产生的日志都是json格式的了。
既然kibana运行正常,那么直接从kibana中操作也很方便。
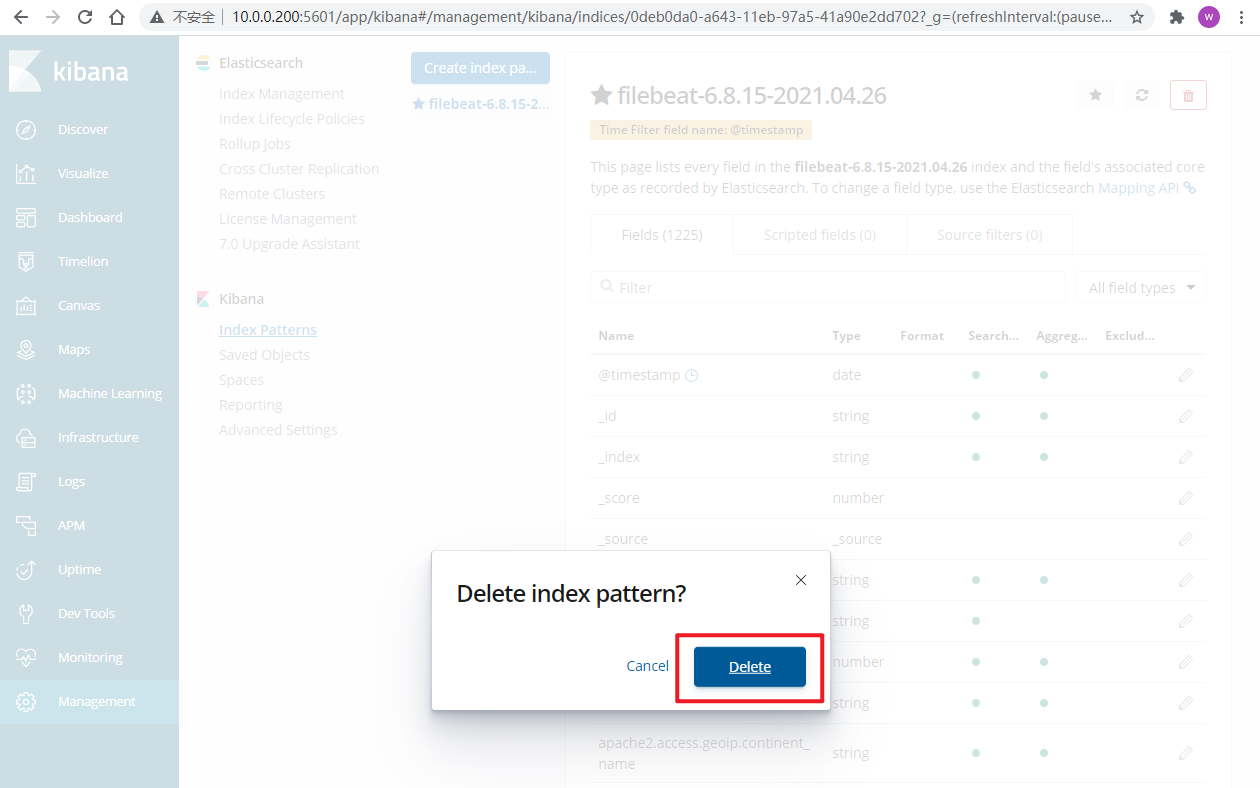
选择之前filebeat的索引,删除掉就完了:
确认删除:
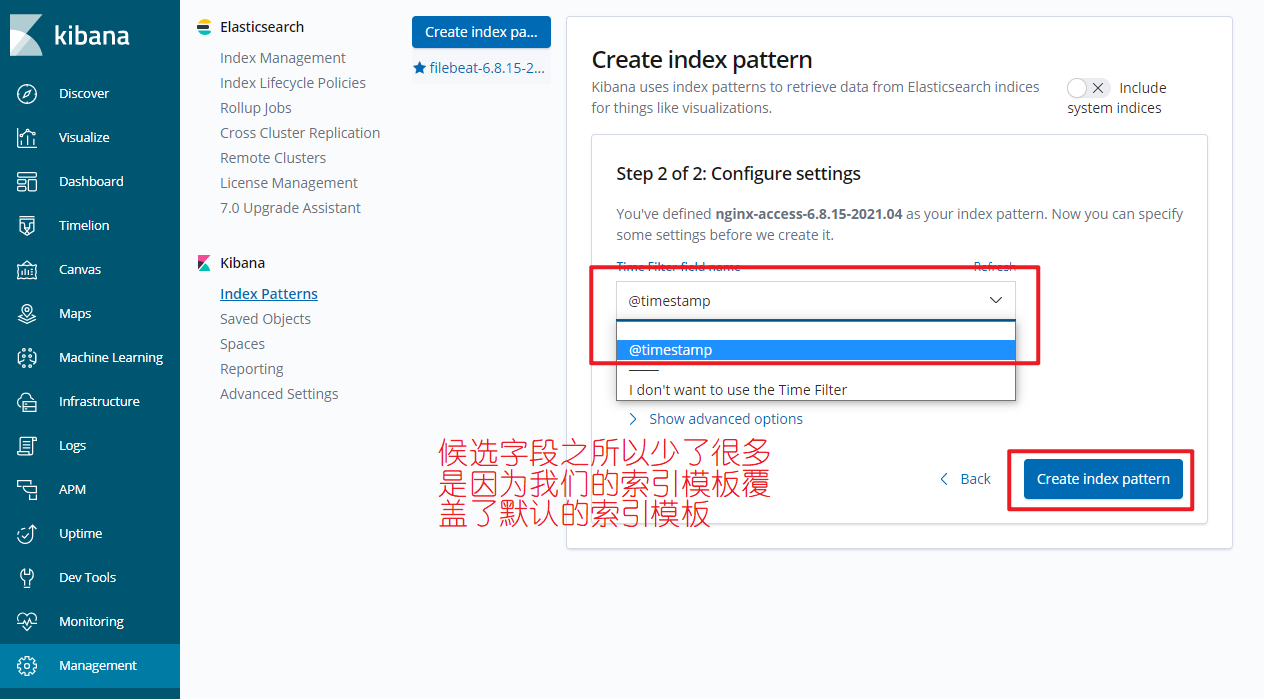
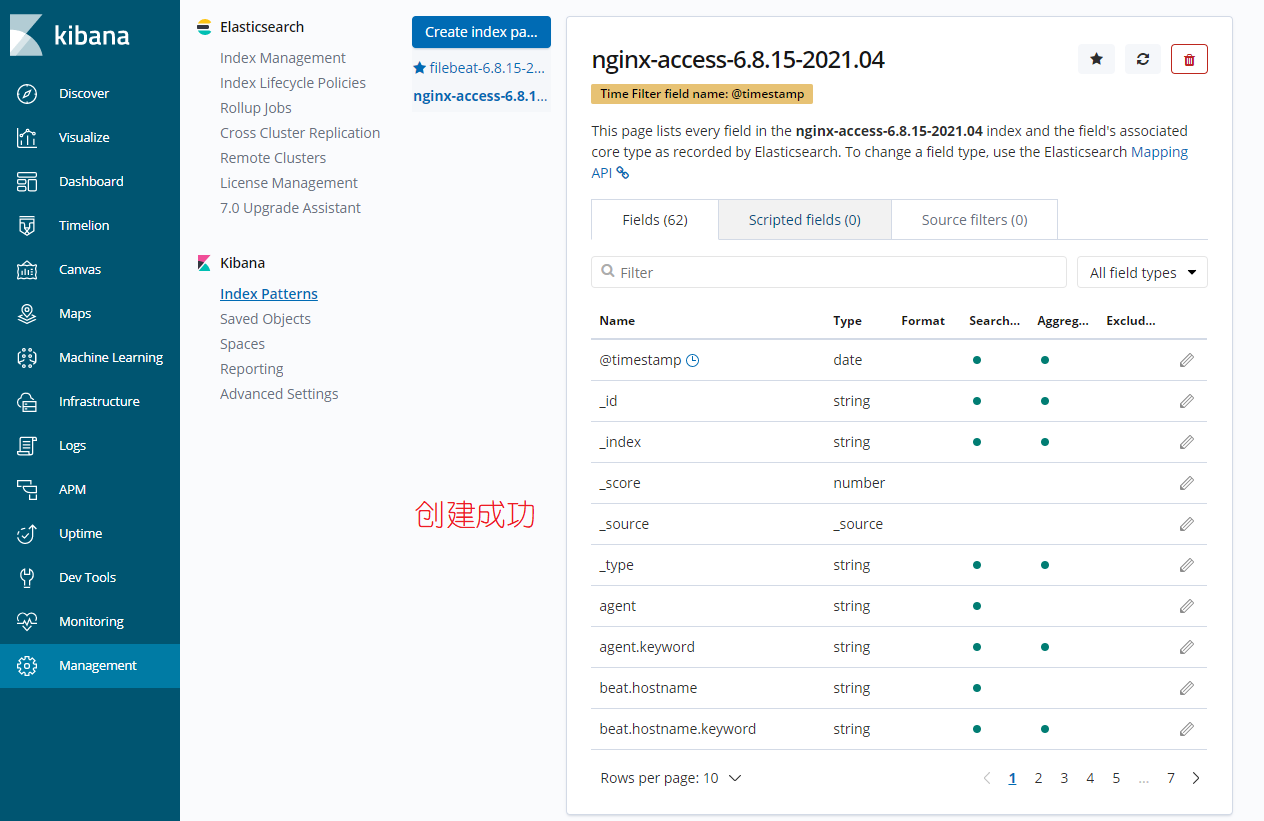
接下来,从新创建一个索引,这个索引接收的数据将都是json类型的数据了:
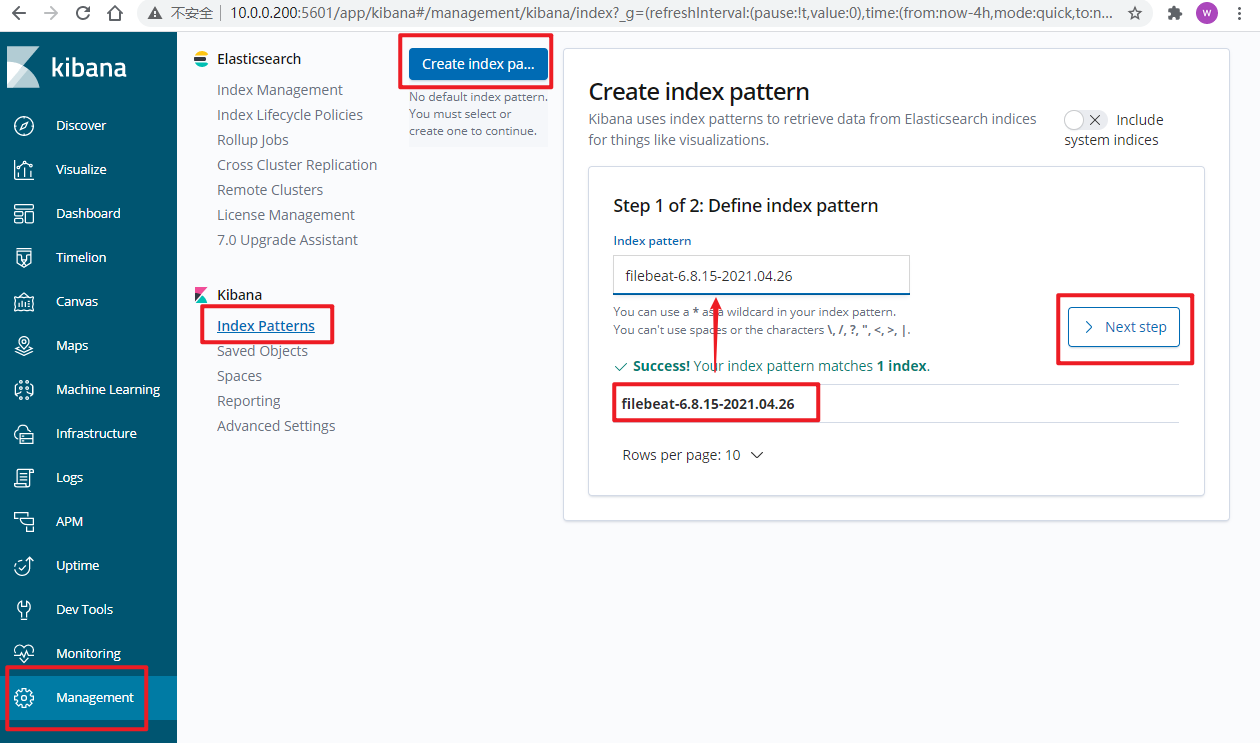

ok,创建成功了。
在discover栏,最近一段时间内,还没有日志数据:
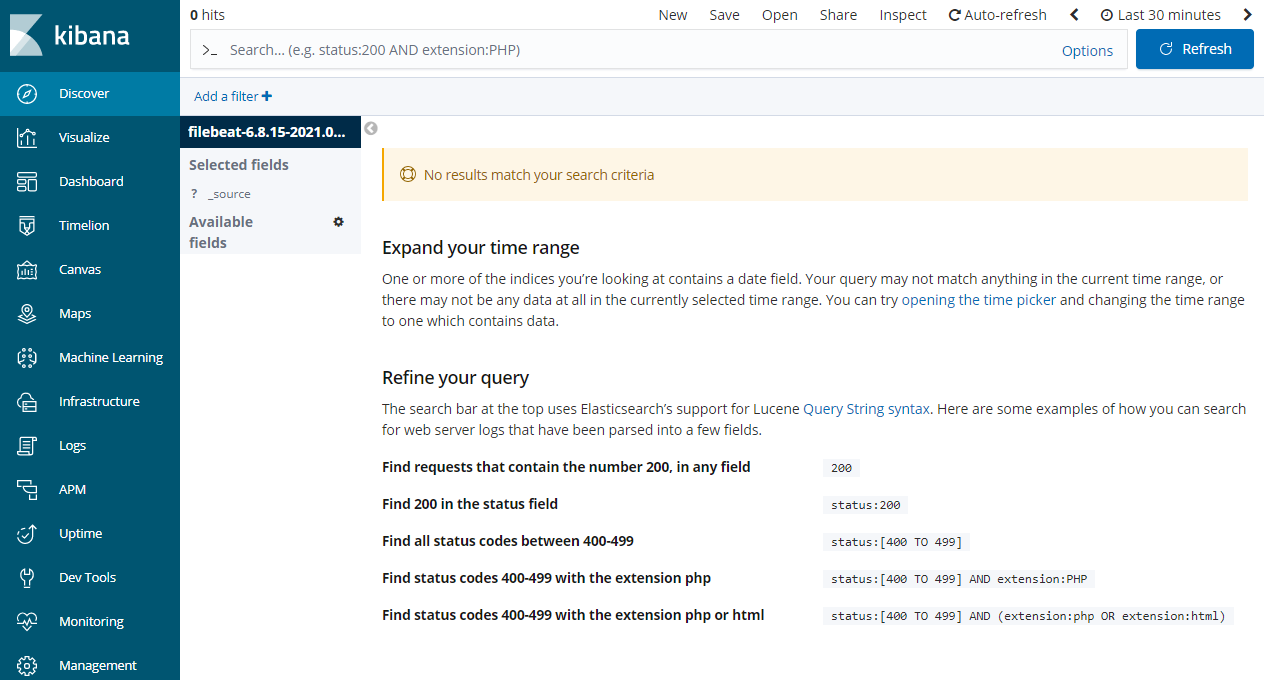
所以,我们可以通过ab命令创建一些数据:
[root@cs ~]# ab -n 10 -c 10 http://10.0.0.200/
[root@cs ~]# ab -n 10 -c 10 http://10.0.0.200/index.html
[root@cs ~]# ab -n 10 -c 10 http://10.0.0.200/home.html
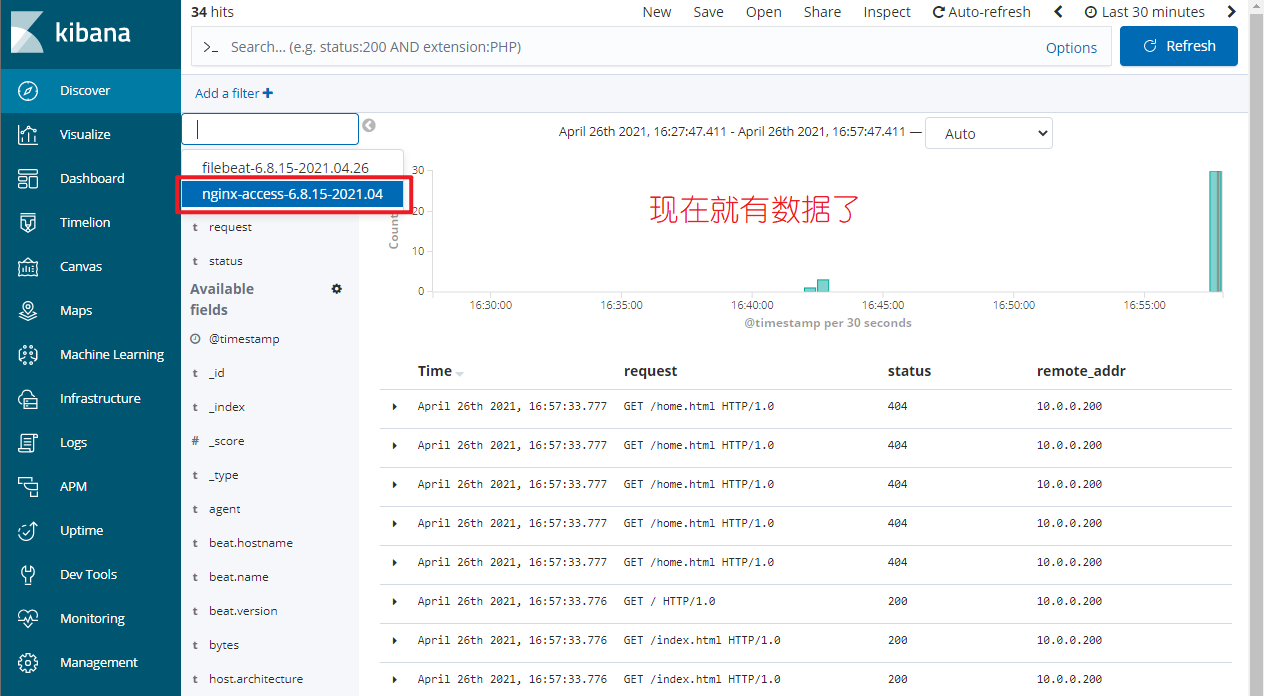
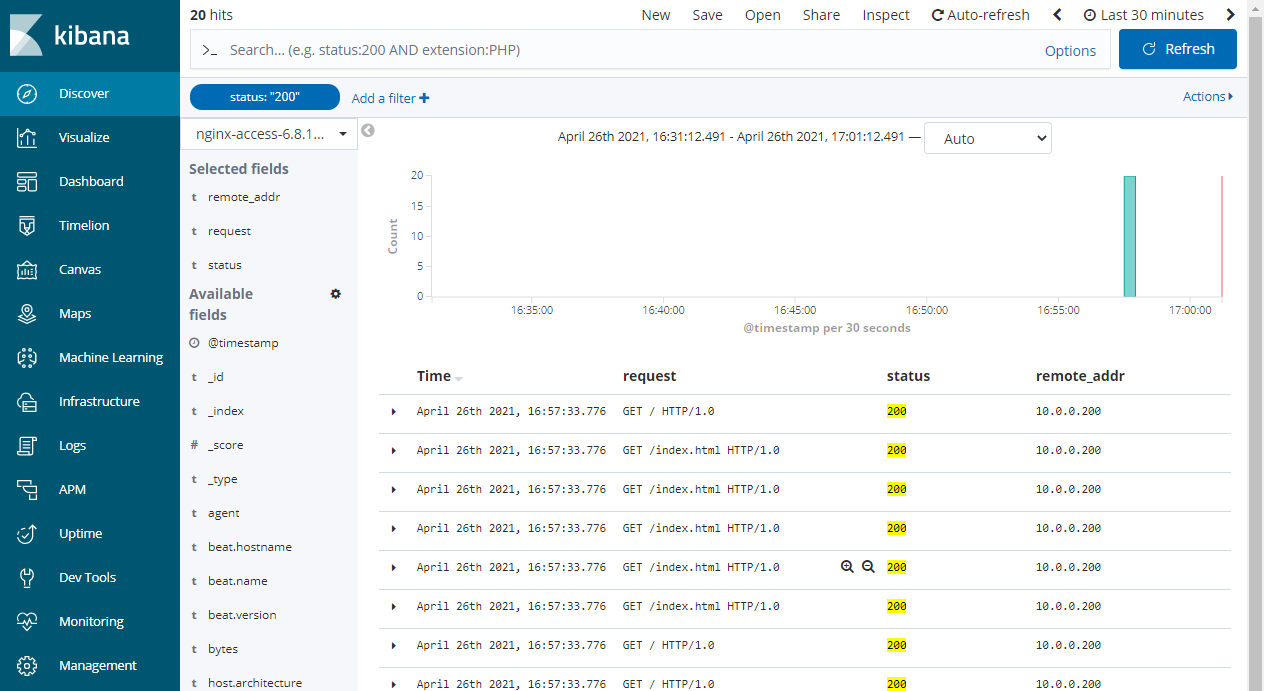
OK了,再来看kibana:
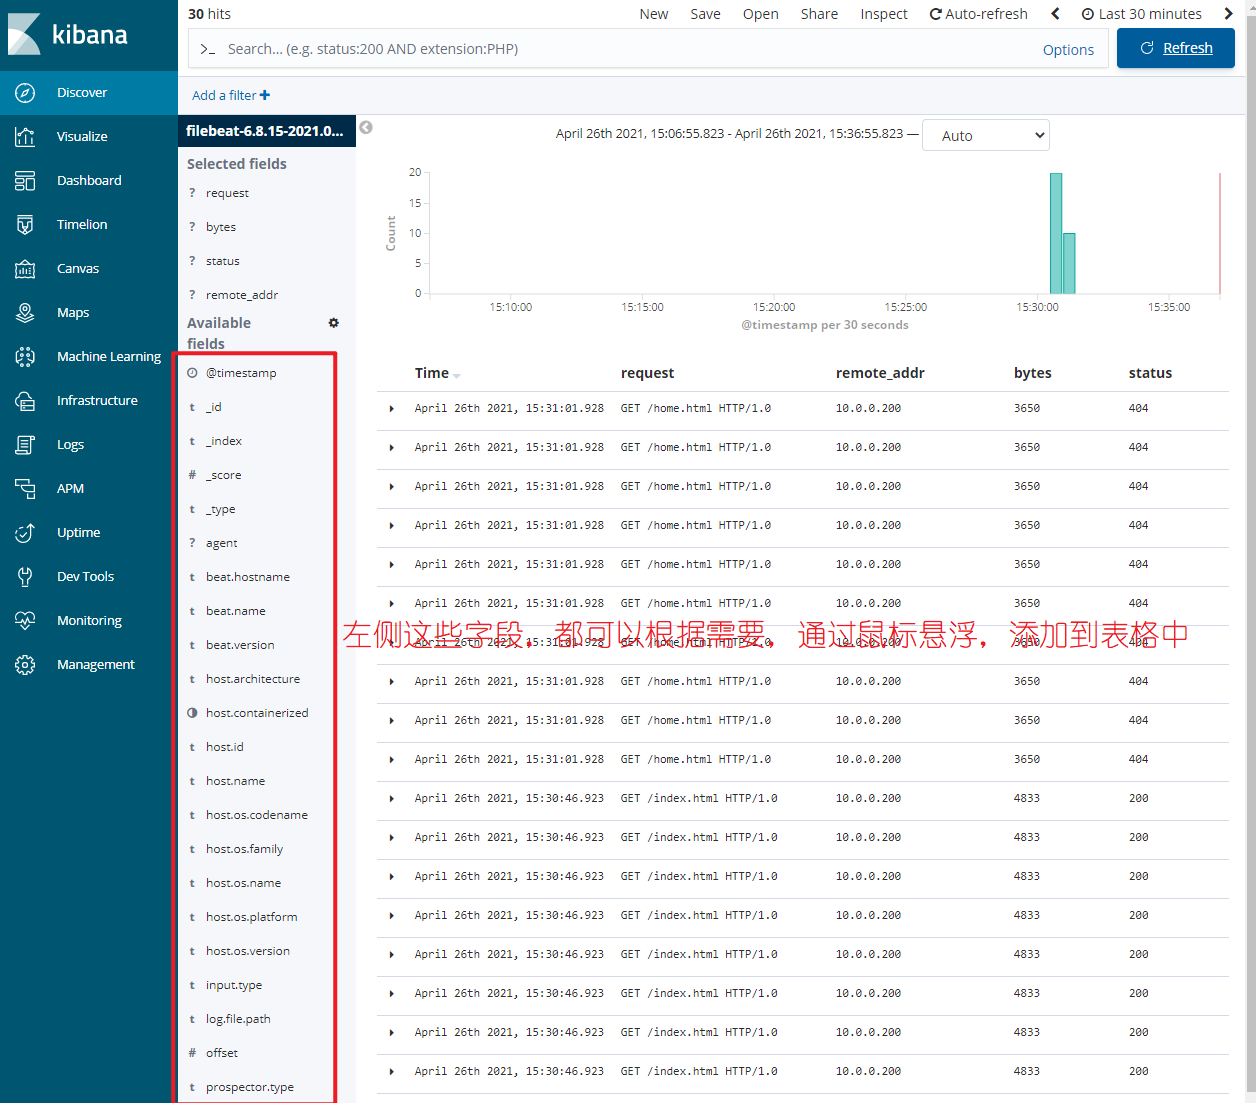
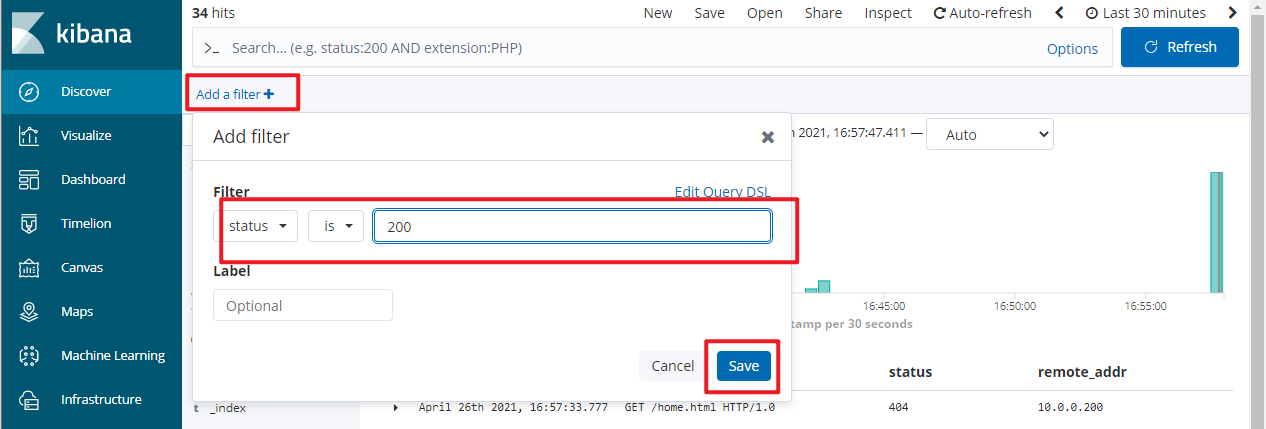
这样,效果就好了很多,你也可以根据需求进行数据过滤,比如过滤响应状态都是200的:

效果马马虎虎吧,但是还是有些问题的,比如说目前的索引是以天建立的,能否自定义更多的功能?答案是可以的,我们往后看。
filebeat按需分割日志
演示环境,还是跟上面一样,都在一台服务器上
https://www.elastic.co/guide/en/beats/filebeat/6.8/index.html
https://www.elastic.co/guide/en/beats/filebeat/6.8/elasticsearch-output.html
https://www.elastic.co/guide/en/beats/filebeat/6.8/configuration-template.html
本小节,我们继续来了解更多关于filebeat的细节信息,比如以月切割日志之类的配置。
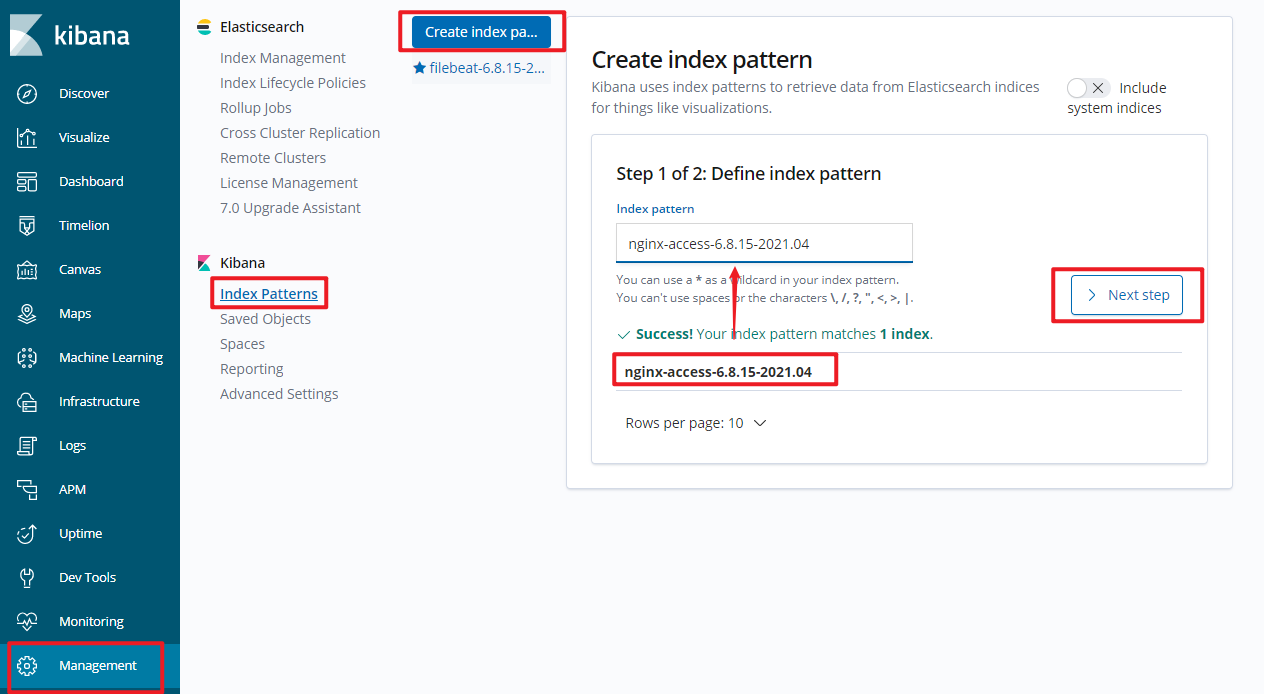
filebeat自定义索引名称,配置以按月分割日志
首先,nginx生成的日志还是json格式的;es和kibana暂时不做更改,保持正常运行即可。
- 修改filebeat配置文件,注意缩进:
# 默认的index模板
index: "filebeat-%{[beat.version]}-%{+yyyy.MM.dd}"

# 根据需要进行修改
index: "nginx-access-%{[beat.version]}-%{+yyyy.MM}"
setup.template.name: "nginx"
setup.template.pattern: "nginx-*"
# 禁用默认模板
setup.template.enabled: false
# 让我自己的模板覆盖掉默认模板
setup.template.overwrite: true
配置完的filebeat配置:
[root@cs ~]# vim /etc/filebeat/filebeat.yml
[root@cs ~]# egrep -v "#|^$" /etc/filebeat/filebeat.yml
filebeat.inputs:
- type: log
  enabled: true
  paths:
    - /var/log/nginx/access.log
  json.keys_under_root: true
  json.overwrite_keys: true
filebeat.config.modules:
  path: ${path.config}/modules.d/*.yml
  reload.enabled: false
setup.template.settings:
  index.number_of_shards: 3
setup.kibana:
output.elasticsearch:
  hosts: ["10.0.0.200:9200"]
  index: "nginx-access-%{[beat.version]}-%{+yyyy.MM}"
setup.template.name: "nginx"
setup.template.pattern: "nginx-*"
setup.template.enabled: false
setup.template.overwrite: true
processors:
  - add_host_metadata: ~
  - add_cloud_metadata: ~
然后重启filebeat,启动成功后,就会创建新的索引:
[root@cs ~]# systemctl restart filebeat
[root@cs ~]# tail -f /var/log/filebeat/filebeat
2021-04-26T16:51:53.701+0800	INFO	registrar/registrar.go:134	Loading registrar data from /var/lib/filebeat/registry
2021-04-26T16:51:53.701+0800	INFO	registrar/registrar.go:141	States Loaded from registrar: 1
2021-04-26T16:51:53.701+0800	INFO	crawler/crawler.go:72	Loading Inputs: 1
2021-04-26T16:51:53.701+0800	INFO	log/input.go:148	Configured paths: [/var/log/nginx/access.log]
2021-04-26T16:51:53.701+0800	INFO	input/input.go:114	Starting input of type: log; ID: 15383831961883387157
2021-04-26T16:51:53.701+0800	INFO	[monitoring]	log/log.go:117	Starting metrics logging every 30s
2021-04-26T16:51:53.702+0800	INFO	crawler/crawler.go:106	Loading and starting Inputs completed. Enabled inputs: 1
2021-04-26T16:51:53.703+0800	INFO	cfgfile/reload.go:150	Config reloader started
2021-04-26T16:51:53.703+0800	INFO	cfgfile/reload.go:205	Loading of config files completed.
2021-04-26T16:51:56.701+0800	INFO	add_cloud_metadata/add_cloud_metadata.go:340	add_cloud_metadata: hosting provider type not detected.
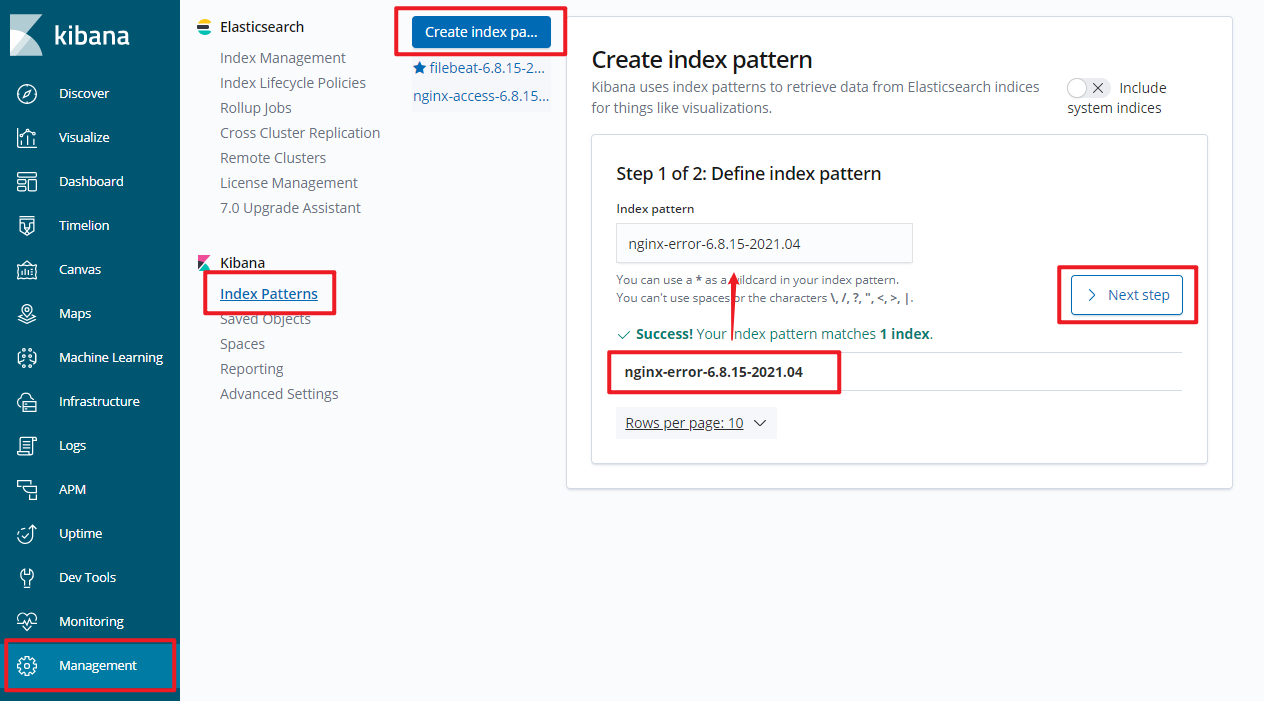
- kibana中操作。
首先添加新索引:
- 来discover栏查看吧。
首先,我们在ab点数据:
ab -n 10 -c 10 http://10.0.0.200/
ab -n 10 -c 10 http://10.0.0.200/index.html
ab -n 10 -c 10 http://10.0.0.200/home.html
来查看:
也可以搜索,也可以添加搜索条件,多个搜索条件之间是and关系。
filebeat同时收集多种日志
演示环境,还是跟上面一样,都在一台服务器上
https://www.elastic.co/guide/en/beats/filebeat/6.8/index.html
https://www.elastic.co/guide/en/beats/filebeat/6.8/elasticsearch-output.html
https://www.elastic.co/guide/en/beats/filebeat/6.8/configuration-template.html
本小节,我们来聊下,如何同时收集nginx日志的access日志和error日志:
[root@cs ~]# ls /var/log/nginx/
access.log  error.log
filebeat同时收集多种日志
思路是什么呢?在filebeat的inputs中,我们可以填写多种日志类型的配置,然后给每种日志类型打个标签;在output到es选项,建立多个索引,然后根据日志标签的不同,分别写入不同的索引中即可。
这里要注意的是此时我的nginx的access日志是json格式,而error没有变,还是普通的文本日志,那么在filebeat配置中,要注意这点。
filebeat配置
[root@cs ~]# vim /etc/filebeat/filebeat.yml

# 配置好的配置文件
[root@cs ~]# egrep -v "#|^$" /etc/filebeat/filebeat.yml
filebeat.inputs:
- type: log
  enabled: true
  paths:
    - /var/log/nginx/access.log
  # 由于access日志文件类型是json,注意加声明
  json.keys_under_root: true
  json.overwrite_keys: true
  # 为当前日志打个标签
  tags: ["access"]
- type: log
  enabled: true
  paths:
    - /var/log/nginx/error.log
  # 为当前日志打个标签
  tags: ["error"]
filebeat.config.modules:
  path: ${path.config}/modules.d/*.yml
  reload.enabled: false
setup.template.settings:
  index.number_of_shards: 3
setup.kibana:
output.elasticsearch:
  hosts: ["10.0.0.200:9200"]
  indices:
    - index: "nginx-access-%{[beat.version]}-%{+yyyy.MM}"
      # 将标签类型是 access 的日志写入到当前索引中
      when.contains:
        tags: "access"
    - index: "nginx-error-%{[beat.version]}-%{+yyyy.MM}"
      # 将标签类型是 access 的日志写入到当前索引中
      when.contains:
        tags: "error"
setup.template.name: "nginx"
setup.template.pattern: "nginx-*"
setup.template.enabled: false
setup.template.overwrite: true
processors:
  - add_host_metadata: ~
  - add_cloud_metadata: ~
然后重启filebeat:
[root@cs ~]# systemctl restart filebeat
[root@cs ~]# tail /var/log/filebeat/filebeat     # 也没有发现报错,说明配置的没问题
2021-04-27T10:13:16.022+0800	INFO	log/input.go:148	Configured paths: [/var/log/nginx/error.log]
2021-04-27T10:13:16.022+0800	INFO	input/input.go:114	Starting input of type: log; ID: 10100389906076279661
2021-04-27T10:13:16.022+0800	INFO	crawler/crawler.go:106	Loading and starting Inputs completed. Enabled inputs: 2
2021-04-27T10:13:16.022+0800	INFO	log/harvester.go:255	Harvester started for file: /var/log/nginx/error.log
2021-04-27T10:13:16.022+0800	INFO	cfgfile/reload.go:150	Config reloader started
2021-04-27T10:13:16.030+0800	INFO	cfgfile/reload.go:205	Loading of config files completed.
2021-04-27T10:13:19.022+0800	INFO	add_cloud_metadata/add_cloud_metadata.go:340	add_cloud_metadata: hosting provider type not detected.
2021-04-27T10:13:20.024+0800	INFO	pipeline/output.go:95	Connecting to backoff(elasticsearch(http://10.0.0.200:9200))
2021-04-27T10:13:20.029+0800	INFO	elasticsearch/client.go:739	Attempting to connect to Elasticsearch version 6.8.15
2021-04-27T10:13:20.051+0800	INFO	pipeline/output.go:105	Connection to backoff(elasticsearch(http://10.0.0.200:9200)) established
ab些数据:
# 包含正常的日志和错误的日志
ab -n 5 -c 5 http://10.0.0.200/
ab -n 5 -c 5 http://10.0.0.200/zhangkai666.html
ab -n 5 -c 5 http://10.0.0.200/likai888.html
kibana中操作
由于access日志索引,我们之间已经配置好了,那么kibana中现在只需要添加error索引即可。


然后discover栏就有了:
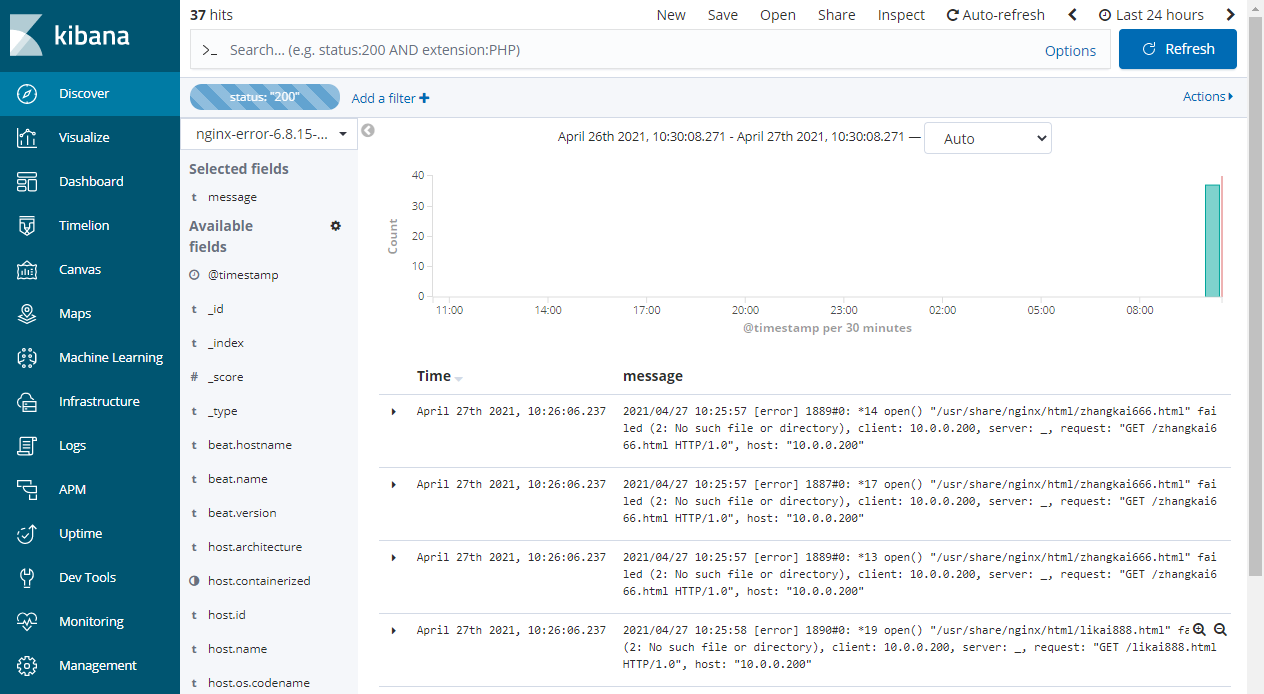
但由于日志格式是普通文本类型,显示效果不是很好,但我们的要演示的效果达到了。
利用这种打标签的方式,可以解决很多问题,比如根据不同的域名进行日志分类。
filebeat收集tomcat日志
filebeat收集tomcat日志的套路跟收集nginx日志一样。
再展开演示之前,我们来聊下tomcat和nginx的关系,一般的二者都可以作为web服务器使用,所以,这两者是二选一的关系。
所以,这里我们再搞一台服务器来专门搭建tomcat并收集其日志。
此时的elk架构是这样的,且各服务器之间的通信正常:
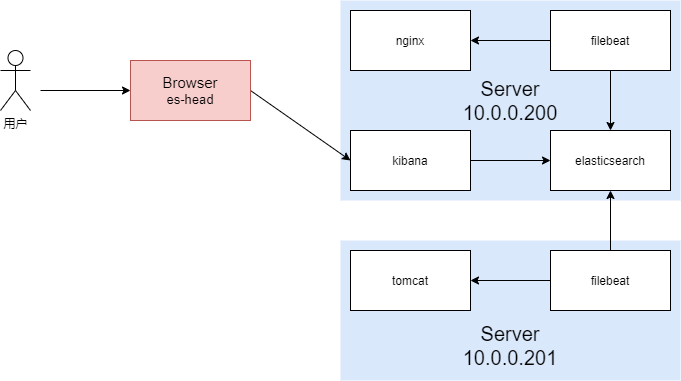
filebeat同时收集多种日志
tomcat安装和配置
当然,tomcat也依赖Java环境,需要提前配置好。
- install,直接使用yum安装即可:
[root@cs ~]# yum install tomcat tomcat-webapps tomcat-admin-webapps tomcat-docs-webapp tomcat-javadoc -y
[root@cs ~]# systemctl start tomcat
前端直接访问8080就可以了,你在各个链接随便点几下,生成一些日志:
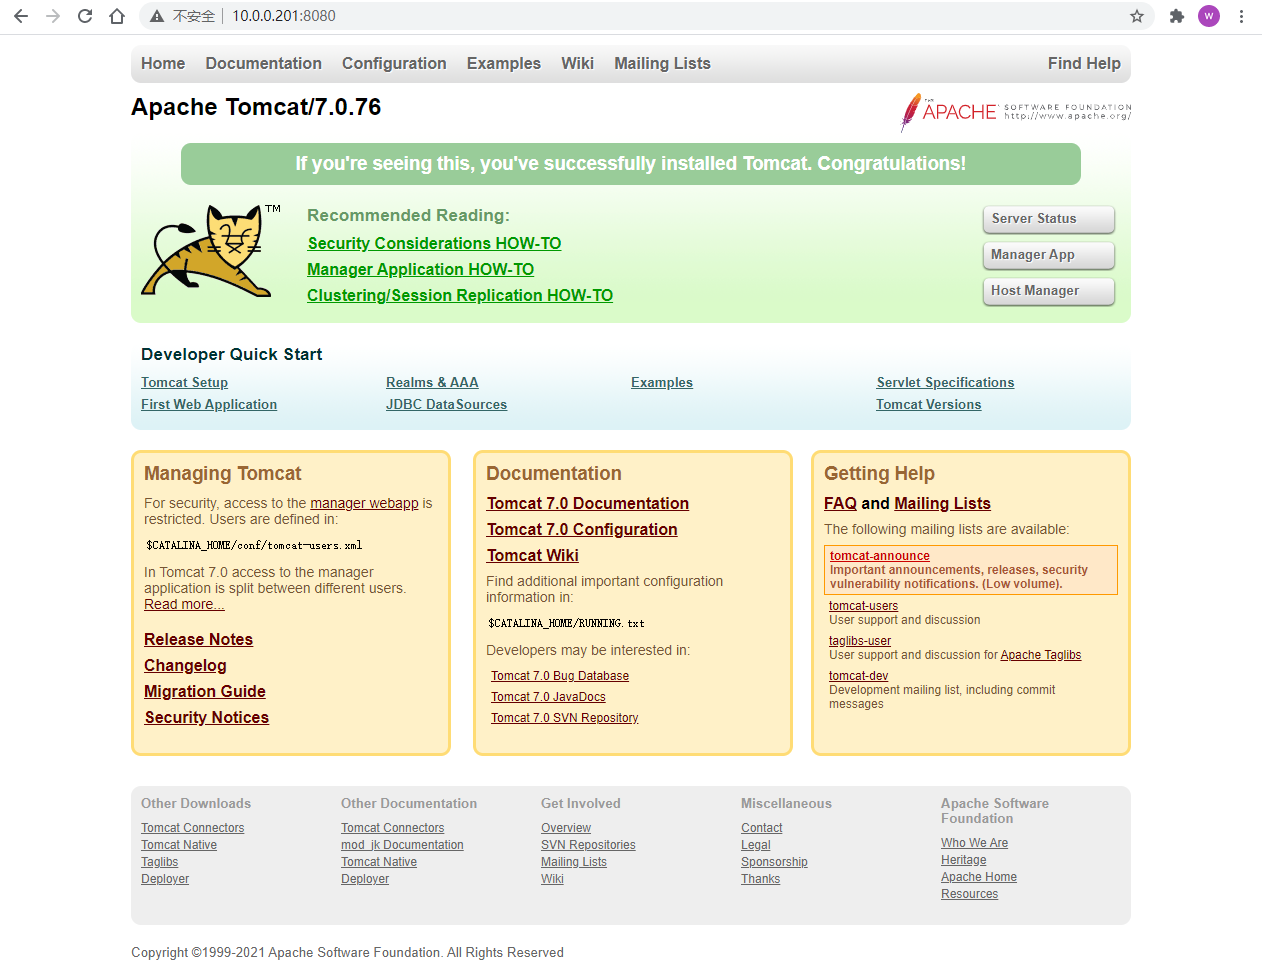
此时,就有了日志:
[root@cs ~]# cat /var/log/tomcat/localhost_access_log.2021-04-27.txt
10.0.0.1 - - [27/Apr/2021:11:25:11 +0800] "GET / HTTP/1.1" 200 11217
10.0.0.1 - - [27/Apr/2021:11:25:11 +0800] "GET /tomcat.png HTTP/1.1" 200 5103
10.0.0.1 - - [27/Apr/2021:11:25:11 +0800] "GET /tomcat.css HTTP/1.1" 200 5581
10.0.0.1 - - [27/Apr/2021:11:25:11 +0800] "GET /asf-logo-wide.svg HTTP/1.1" 200 26447
10.0.0.1 - - [27/Apr/2021:11:25:11 +0800] "GET /bg-nav.png HTTP/1.1" 200 1401
10.0.0.1 - - [27/Apr/2021:11:25:11 +0800] "GET /bg-button.png HTTP/1.1" 200 713
10.0.0.1 - - [27/Apr/2021:11:25:11 +0800] "GET /bg-middle.png HTTP/1.1" 200 1918
10.0.0.1 - - [27/Apr/2021:11:25:11 +0800] "GET /bg-upper.png HTTP/1.1" 200 3103
10.0.0.1 - - [27/Apr/2021:11:25:11 +0800] "GET /favicon.ico HTTP/1.1" 200 21630
10.0.0.1 - - [27/Apr/2021:11:26:29 +0800] "GET /docs/manager-howto.html HTTP/1.1" 200 80158
10.0.0.1 - - [27/Apr/2021:11:26:29 +0800] "GET /docs/images/tomcat.gif HTTP/1.1" 200 2066
10.0.0.1 - - [27/Apr/2021:11:26:29 +0800] "GET /docs/images/asf-logo.svg HTTP/1.1" 200 19698
10.0.0.1 - - [27/Apr/2021:11:26:31 +0800] "GET /docs/jndi-datasource-examples-howto.html HTTP/1.1" 200 40481
10.0.0.1 - - [27/Apr/2021:11:26:34 +0800] "GET /docs/RELEASE-NOTES.txt HTTP/1.1" 200 8965
10.0.0.1 - - [27/Apr/2021:11:26:36 +0800] "GET /docs/ HTTP/1.1" 200 19130
10.0.0.1 - - [27/Apr/2021:11:26:38 +0800] "GET /manager/html HTTP/1.1" 401 2473
10.0.0.1 - - [27/Apr/2021:11:26:40 +0800] "GET /manager/html HTTP/1.1" 401 2473
10.0.0.1 - - [27/Apr/2021:11:26:43 +0800] "GET /docs/security-howto.html HTTP/1.1" 200 43375
10.0.0.1 - - [27/Apr/2021:11:26:55 +0800] "GET /docs/realm-howto.html HTTP/1.1" 200 66384
10.0.0.1 - - [27/Apr/2021:11:26:57 +0800] "GET /examples/ HTTP/1.1" 200 1253
10.0.0.1 - - [27/Apr/2021:11:27:03 +0800] "GET /docs/appdev/ HTTP/1.1" 200 8539
tomcat日志文件是以天为分割的,且是普通的文本,我们这里也可以配置为json格式的。
[root@cs ~]# systemctl stop tomcat
[root@cs ~]# > /var/log/tomcat/localhost_access_log.2021-04-27.txt # 先把之前的普通文本日志内容清空
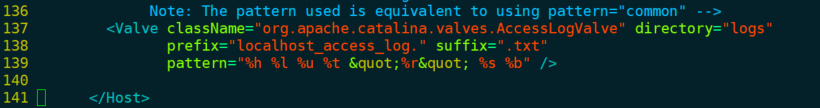
[root@cs ~]# vim /etc/tomcat/server.xml
[root@cs ~]# systemctl start tomcat
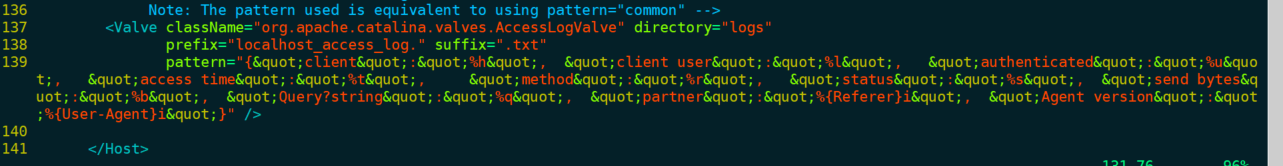
将下图Value标签中的pattern选项内容替换为:
{"client":"%h", "client user":"%l", "authenticated":"%u", "access time":"%t", "method":"%r", "status":"%s", "send bytes":"%b", "Query?string":"%q", "partner":"%{Referer}i", "Agent version":"%{User-Agent}i"}
before:
after:
再重新访问8080端口,随便点点产生些日志,再看日志文件:
[root@cs ~]# cat /var/log/tomcat/localhost_access_log.2021-04-27.txt
{"client":"10.0.0.1",  "client user":"-",   "authenticated":"-",   "access time":"[27/Apr/2021:11:34:38 +0800]",     "method":"GET / HTTP/1.1",   "status":"200",  "send bytes":"11217",  "Query?string":"",  "partner":"-",  "Agent version":"Mozilla/5.0 (Windows NT 10.0; Win64; x64) AppleWebKit/537.36 (KHTML, like Gecko) Chrome/88.0.4324.190 Safari/537.36"}
{"client":"10.0.0.1",  "client user":"-",   "authenticated":"-",   "access time":"[27/Apr/2021:11:34:38 +0800]",     "method":"GET /favicon.ico HTTP/1.1",   "status":"200",  "send bytes":"21630",  "Query?string":"",  "partner":"http://10.0.0.201:8080/",  "Agent version":"Mozilla/5.0 (Windows NT 10.0; Win64; x64) AppleWebKit/537.36 (KHTML, like Gecko) Chrome/88.0.4324.190 Safari/537.36"}
OK,tomcat这边配置完事了。
filebeat配置
我这里的filebeat已经通过rpm的方式安装好了。
编辑配置文件:
[root@cs ~]# vim /etc/filebeat/filebeat.yml
[root@cs ~]# egrep -v "#|^$" /etc/filebeat/filebeat.yml
filebeat.inputs:
- type: log
  enabled: true
  paths:
    - /var/log/tomcat/localhost_access_log.*.txt    # 这个*代表收集所有以localhost_access_log开头的,后面的任意日期都可以,你可以根据实际需求进行修改
  json.keys_under_root: true
  json.overwrite_keys: true
filebeat.config.modules:
  path: ${path.config}/modules.d/*.yml
  reload.enabled: false
setup.template.settings:
  index.number_of_shards: 3
setup.kibana:
output.elasticsearch:
  hosts: ["10.0.0.200:9200"]
  index: "tomcat-access-%{[beat.version]}-%{+yyyy.MM}"
setup.template.name: "tomcat"
setup.template.pattern: "tomcat-*"
setup.template.enabled: false
setup.template.overwrite: true
processors:
  - add_host_metadata: ~
  - add_cloud_metadata: ~
完事后启动filebeat:
[root@cs ~]# systemctl start filebeat
[root@cs ~]# tail -f /var/log/filebeat/filebeat
2021-04-27T11:43:07.573+0800	INFO	log/input.go:148	Configured paths: [/var/log/tomcat/localhost_access_log.*.txt]
2021-04-27T11:43:07.573+0800	INFO	input/input.go:114	Starting input of type: log; ID: 17642374418577236616
2021-04-27T11:43:07.574+0800	INFO	crawler/crawler.go:106	Loading and starting Inputs completed. Enabled inputs: 1
2021-04-27T11:43:07.575+0800	INFO	log/harvester.go:255	Harvester started for file: /var/log/tomcat/localhost_access_log.2021-04-27.txt
2021-04-27T11:43:07.575+0800	INFO	cfgfile/reload.go:150	Config reloader started
2021-04-27T11:43:07.575+0800	INFO	cfgfile/reload.go:205	Loading of config files completed.
2021-04-27T11:43:10.572+0800	INFO	add_cloud_metadata/add_cloud_metadata.go:340	add_cloud_metadata: hosting provider type not detected.
2021-04-27T11:43:11.575+0800	INFO	pipeline/output.go:95	Connecting to backoff(elasticsearch(http://10.0.0.200:9200))
2021-04-27T11:43:11.580+0800	INFO	elasticsearch/client.go:739	Attempting to connect to Elasticsearch version 6.8.15
2021-04-27T11:43:11.602+0800	INFO	pipeline/output.go:105	Connection to backoff(elasticsearch(http://10.0.0.200:9200)) established
没有报错,那我们此时,我们认为关于filebeat和tomcat的配置已经完成了。
kibana配置
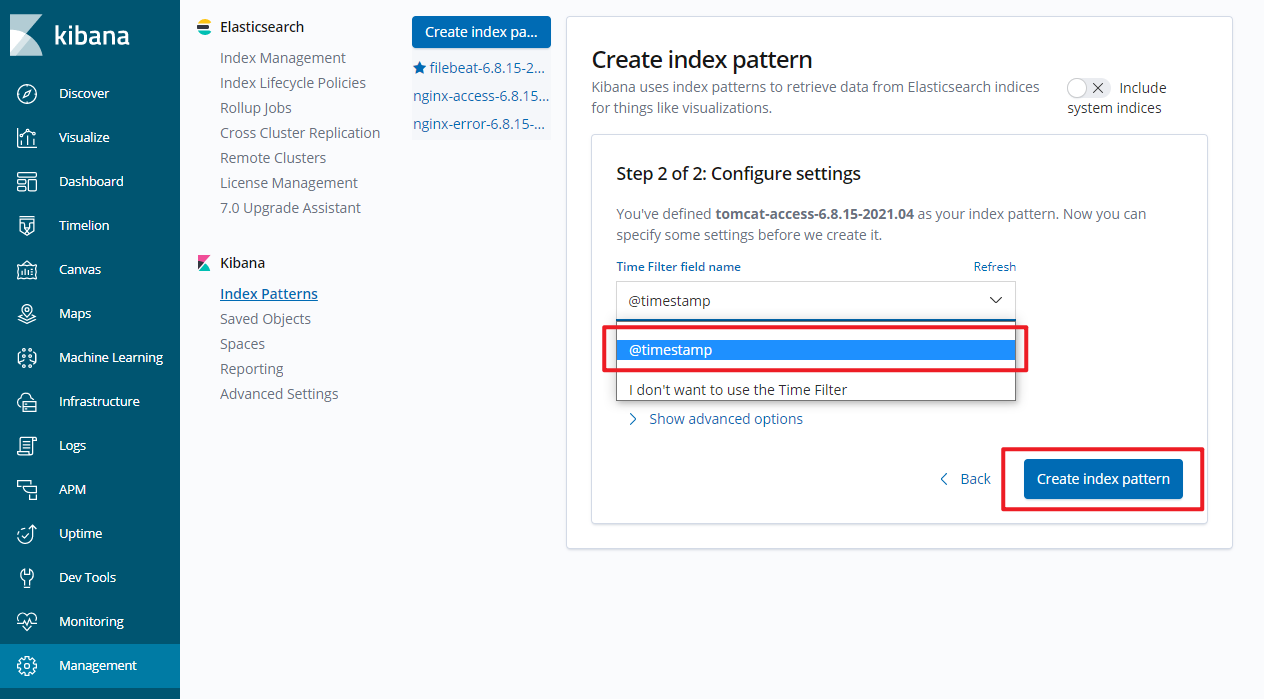
- 还是老套路,添加tomcat索引。

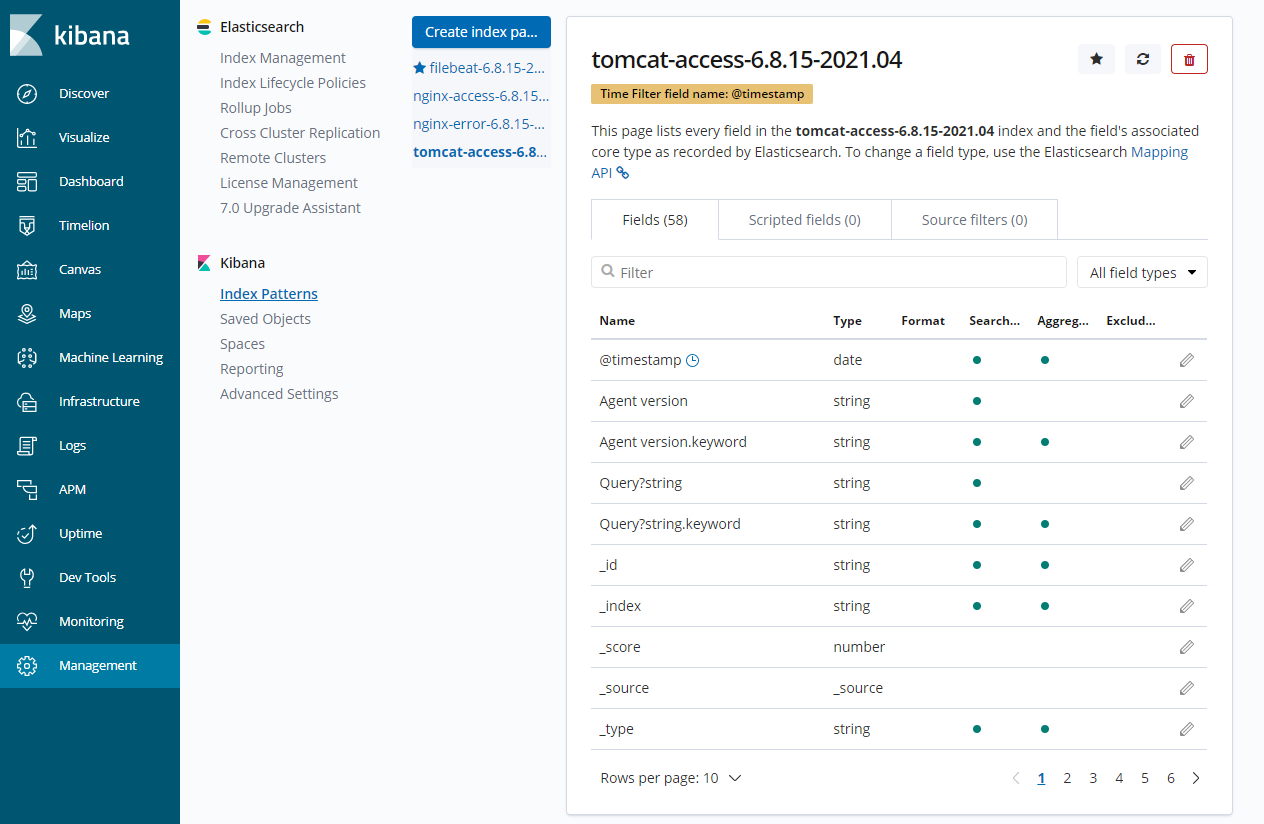
- 来discover栏查看吧。
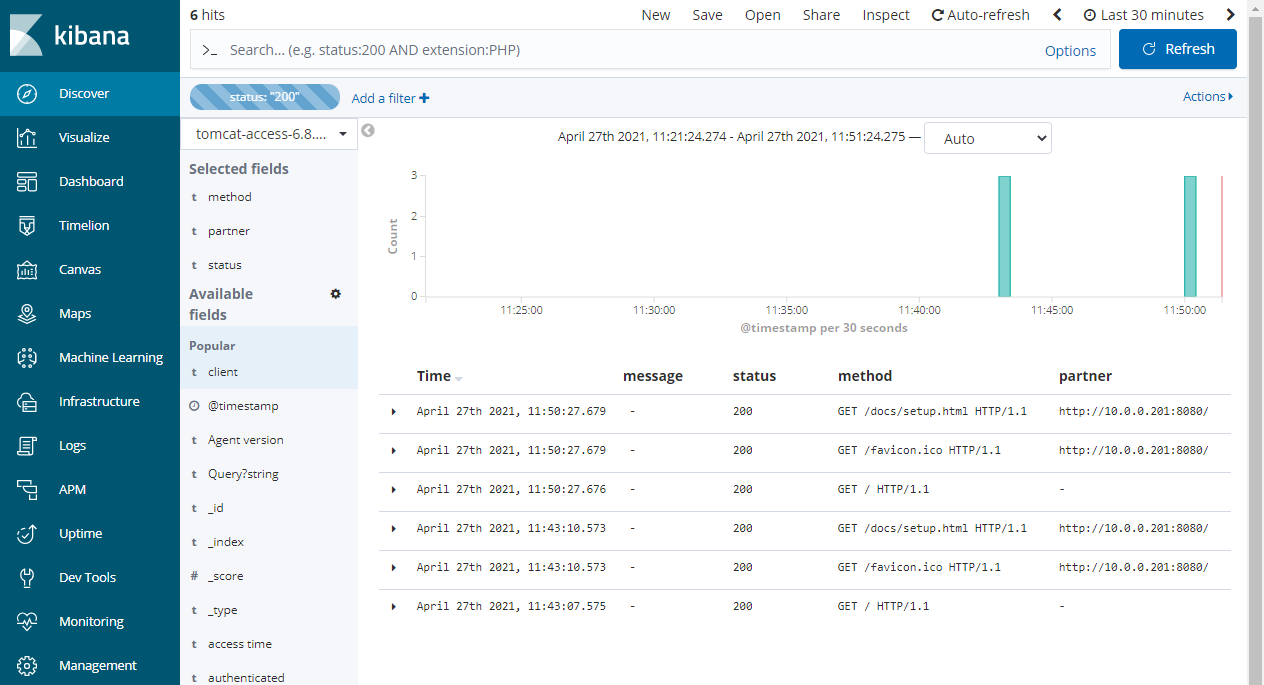
OK了。
filebeat收集多行日志
https://www.elastic.co/guide/en/beats/filebeat/6.8/multiline-examples.html
上面演示的都是收集一行或者json类型的日志,那么如果多行日志该怎么收集呢?比如收集es自己的日志信息?
我们来一起看下怎么搞。
filebeat收集多行日志
先分析es的日志:
[2021-04-27T09:12:56,016][INFO ][o.e.c.m.MetaDataIndexTemplateService] [node-1] adding template [.management-beats] for index patterns [.management-beats]
[2021-04-27T09:12:56,236][DEBUG][o.e.a.s.TransportSearchAction] [node-1] All shards failed for phase: [query]
[2021-04-27T09:12:56,245][DEBUG][o.e.a.s.TransportSearchAction] [node-1] All shards failed for phase: [query]
[2021-04-27T12:33:53,174][INFO ][o.e.p.PluginsService     ] [node-1] loaded plugin [analysis-ik]
[2021-04-27T12:33:55,124][ERROR][o.e.b.Bootstrap          ] [node-1] Exception
java.lang.IllegalArgumentException: unknown setting [ahttp.cors.allow-origin] did you mean [http.cors.allow-origin]?
	at org.elasticsearch.common.settings.AbstractScopedSettings.validate(AbstractScopedSettings.java:530) ~[elasticsearch-6.8.15.jar:6.8.15]
	at org.elasticsearch.common.settings.AbstractScopedSettings.validate(AbstractScopedSettings.java:475) ~[elasticsearch-6.8.15.jar:6.8.15]
	at org.elasticsearch.common.settings.AbstractScopedSettings.validate(AbstractScopedSettings.java:446) ~[elasticsearch-6.8.15.jar:6.8.15]
	at org.elasticsearch.common.settings.AbstractScopedSettings.validate(AbstractScopedSettings.java:417) ~[elasticsearch-6.8.15.jar:6.8.15]
	at org.elasticsearch.common.settings.SettingsModule.<init>(SettingsModule.java:148) ~[elasticsearch-6.8.15.jar:6.8.15]
	at org.elasticsearch.node.Node.<init>(Node.java:374) ~[elasticsearch-6.8.15.jar:6.8.15]
	at org.elasticsearch.node.Node.<init>(Node.java:266) ~[elasticsearch-6.8.15.jar:6.8.15]
	at org.elasticsearch.bootstrap.Bootstrap$5.<init>(Bootstrap.java:212) ~[elasticsearch-6.8.15.jar:6.8.15]
	at org.elasticsearch.bootstrap.Bootstrap.setup(Bootstrap.java:212) ~[elasticsearch-6.8.15.jar:6.8.15]
	at org.elasticsearch.bootstrap.Bootstrap.init(Bootstrap.java:333) [elasticsearch-6.8.15.jar:6.8.15]
	at org.elasticsearch.bootstrap.Elasticsearch.init(Elasticsearch.java:159) [elasticsearch-6.8.15.jar:6.8.15]
	at org.elasticsearch.bootstrap.Elasticsearch.execute(Elasticsearch.java:150) [elasticsearch-6.8.15.jar:6.8.15]
	at org.elasticsearch.cli.EnvironmentAwareCommand.execute(EnvironmentAwareCommand.java:86) [elasticsearch-6.8.15.jar:6.8.15]
	at org.elasticsearch.cli.Command.mainWithoutErrorHandling(Command.java:124) [elasticsearch-cli-6.8.15.jar:6.8.15]
	at org.elasticsearch.cli.Command.main(Command.java:90) [elasticsearch-cli-6.8.15.jar:6.8.15]
	at org.elasticsearch.bootstrap.Elasticsearch.main(Elasticsearch.java:116) [elasticsearch-6.8.15.jar:6.8.15]
	at org.elasticsearch.bootstrap.Elasticsearch.main(Elasticsearch.java:93) [elasticsearch-6.8.15.jar:6.8.15]
[2021-04-27T12:33:55,129][WARN ][o.e.b.ElasticsearchUncaughtExceptionHandler] [node-1] uncaught exception in thread [main]
org.elasticsearch.bootstrap.StartupException: java.lang.IllegalArgumentException: unknown setting [ahttp.cors.allow-origin] did you mean [http.cors.allow-origin]?
	at org.elasticsearch.bootstrap.Elasticsearch.init(Elasticsearch.java:163) ~[elasticsearch-6.8.15.jar:6.8.15]
	at org.elasticsearch.bootstrap.Elasticsearch.execute(Elasticsearch.java:150) ~[elasticsearch-6.8.15.jar:6.8.15]
	at org.elasticsearch.cli.EnvironmentAwareCommand.execute(EnvironmentAwareCommand.java:86) ~[elasticsearch-6.8.15.jar:6.8.15]
	at org.elasticsearch.cli.Command.mainWithoutErrorHandling(Command.java:124) ~[elasticsearch-cli-6.8.15.jar:6.8.15]
	at org.elasticsearch.cli.Command.main(Command.java:90) ~[elasticsearch-cli-6.8.15.jar:6.8.15]
	at org.elasticsearch.bootstrap.Elasticsearch.main(Elasticsearch.java:116) ~[elasticsearch-6.8.15.jar:6.8.15]
	at org.elasticsearch.bootstrap.Elasticsearch.main(Elasticsearch.java:93) ~[elasticsearch-6.8.15.jar:6.8.15]
Caused by: java.lang.IllegalArgumentException: unknown setting [ahttp.cors.allow-origin] did you mean [http.cors.allow-origin]?
	at org.elasticsearch.common.settings.AbstractScopedSettings.validate(AbstractScopedSettings.java:530) ~[elasticsearch-6.8.15.jar:6.8.15]
	at org.elasticsearch.common.settings.AbstractScopedSettings.validate(AbstractScopedSettings.java:475) ~[elasticsearch-6.8.15.jar:6.8.15]
	at org.elasticsearch.common.settings.AbstractScopedSettings.validate(AbstractScopedSettings.java:446) ~[elasticsearch-6.8.15.jar:6.8.15]
	at org.elasticsearch.common.settings.AbstractScopedSettings.validate(AbstractScopedSettings.java:417) ~[elasticsearch-6.8.15.jar:6.8.15]
	at org.elasticsearch.common.settings.SettingsModule.<init>(SettingsModule.java:148) ~[elasticsearch-6.8.15.jar:6.8.15]
	at org.elasticsearch.node.Node.<init>(Node.java:374) ~[elasticsearch-6.8.15.jar:6.8.15]
	at org.elasticsearch.node.Node.<init>(Node.java:266) ~[elasticsearch-6.8.15.jar:6.8.15]
	at org.elasticsearch.bootstrap.Bootstrap$5.<init>(Bootstrap.java:212) ~[elasticsearch-6.8.15.jar:6.8.15]
	at org.elasticsearch.bootstrap.Bootstrap.setup(Bootstrap.java:212) ~[elasticsearch-6.8.15.jar:6.8.15]
	at org.elasticsearch.bootstrap.Bootstrap.init(Bootstrap.java:333) ~[elasticsearch-6.8.15.jar:6.8.15]
	at org.elasticsearch.bootstrap.Elasticsearch.init(Elasticsearch.java:159) ~[elasticsearch-6.8.15.jar:6.8.15]
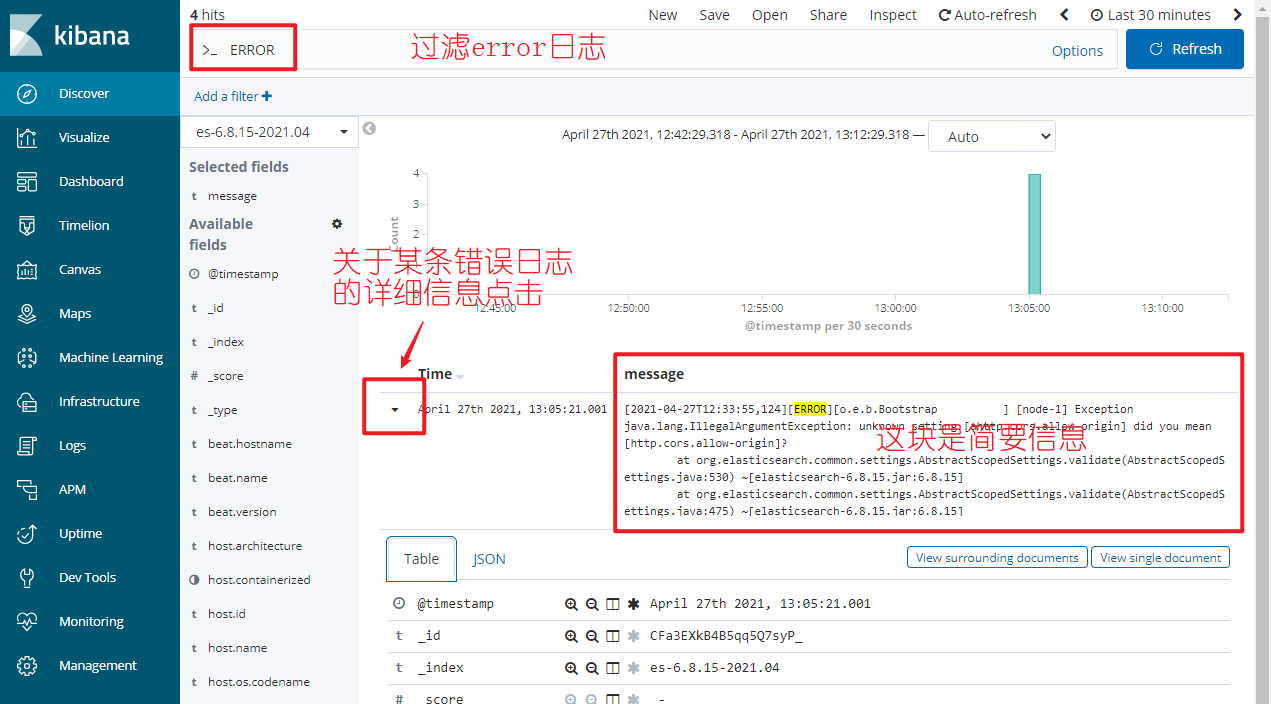
可以看到,如果是普通的info或者debug日志,基本上一行就行了,但是如果遇到error或者warning那就是好多行才能算作一个完整的日志信息。所以按照普通的日志收集配置,很显然不行。我们需要针对这种多行的日志形式,进行特殊的配置。
filebeat配置
[root@cs data]# vim /etc/filebeat/filebeat.yml
[root@cs data]# egrep -v "#|^$" /etc/filebeat/filebeat.yml
filebeat.inputs:
- type: log
  enabled: true
  paths:
    - /var/log/nginx/access.log
  json.keys_under_root: true
  json.overwrite_keys: true
  tags: ["access"]
- type: log
  enabled: true
  paths:
    - /var/log/nginx/error.log
  tags: ["error"]
- type: log
  enabled: true
  paths:
    - /var/log/elasticsearch/elasticsearch.log
  tags: ["es"]
  # 重点就是下面三行配置
  multiline.pattern: '^\['
  multiline.negate: true
  multiline.match: after
filebeat.config.modules:
  path: ${path.config}/modules.d/*.yml
  reload.enabled: false
setup.template.settings:
  index.number_of_shards: 3
setup.kibana:
output.elasticsearch:
  hosts: ["10.0.0.200:9200"]
  indices:
    - index: "nginx-access-%{[beat.version]}-%{+yyyy.MM}"
      when.contains:
        tags: "access"
    - index: "nginx-error-%{[beat.version]}-%{+yyyy.MM}"
      when.contains:
        tags: "error"
    - index: "es-%{[beat.version]}-%{+yyyy.MM}"
      when.contains:
        tags: "es"
setup.template.name: "nginx"
setup.template.pattern: "nginx-*"
setup.template.enabled: false
setup.template.overwrite: true
processors:
  - add_host_metadata: ~
  - add_cloud_metadata: ~
重启filebeat:
[root@cs data]# systemctl restart filebeat
[root@cs data]# tail -f /var/log/filebeat/filebeat
2021-04-27T13:05:17.992+0800	INFO	log/input.go:148	Configured paths: [/var/log/nginx/access.log]
2021-04-27T13:05:17.992+0800	INFO	input/input.go:114	Starting input of type: log; ID: 6064193771121672120
2021-04-27T13:05:17.994+0800	INFO	log/input.go:148	Configured paths: [/var/log/nginx/error.log]
2021-04-27T13:05:17.994+0800	INFO	input/input.go:114	Starting input of type: log; ID: 10100389906076279661
2021-04-27T13:05:17.994+0800	INFO	log/input.go:148	Configured paths: [/var/log/elasticsearch/elasticsearch.log]
2021-04-27T13:05:17.994+0800	INFO	input/input.go:114	Starting input of type: log; ID: 335975315166146607
2021-04-27T13:05:17.994+0800	INFO	cfgfile/reload.go:150	Config reloader started
2021-04-27T13:05:17.994+0800	INFO	crawler/crawler.go:106	Loading and starting Inputs completed. Enabled inputs: 3
2021-04-27T13:05:17.995+0800	INFO	log/harvester.go:255	Harvester started for file: /var/log/elasticsearch/elasticsearch.log
2021-04-27T13:05:17.995+0800	INFO	cfgfile/reload.go:205	Loading of config files completed.
2021-04-27T13:05:20.993+0800	INFO	add_cloud_metadata/add_cloud_metadata.go:340	add_cloud_metadata: hosting provider type not detected.
2021-04-27T13:05:21.996+0800	INFO	pipeline/output.go:95	Connecting to backoff(elasticsearch(http://10.0.0.200:9200))
2021-04-27T13:05:22.004+0800	INFO	elasticsearch/client.go:739	Attempting to connect to Elasticsearch version 6.8.15
2021-04-27T13:05:22.030+0800	INFO	pipeline/output.go:105	Connection to backoff(elasticsearch(http://10.0.0.200:9200)) established
kibana配置
还是添加索引:
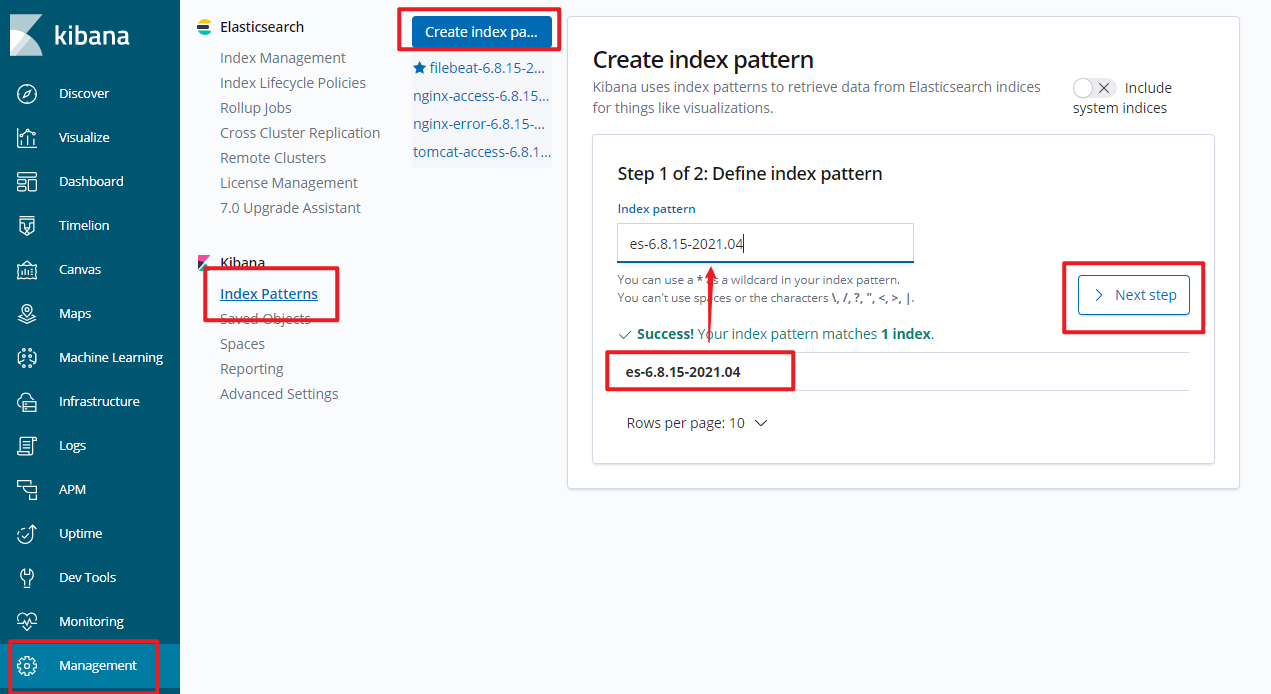
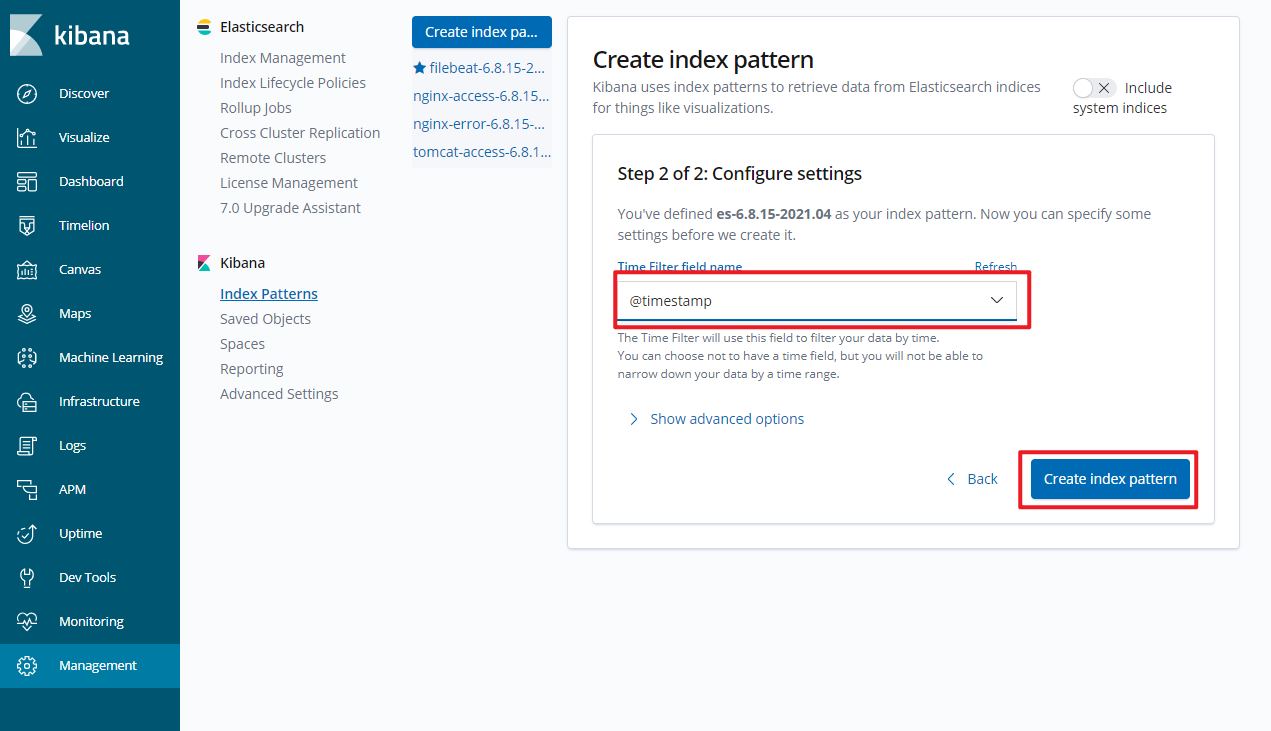
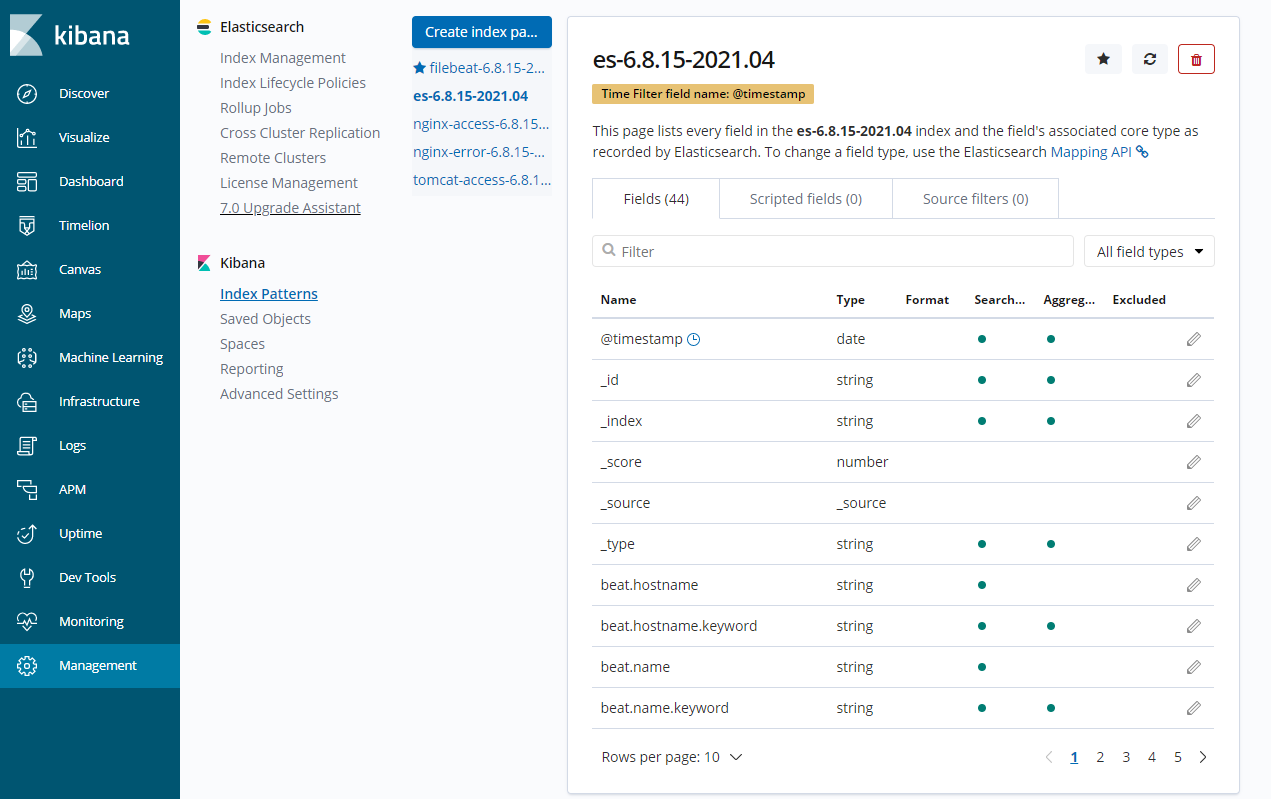
然后discover栏查看:
that's all,see also:

 浙公网安备 33010602011771号