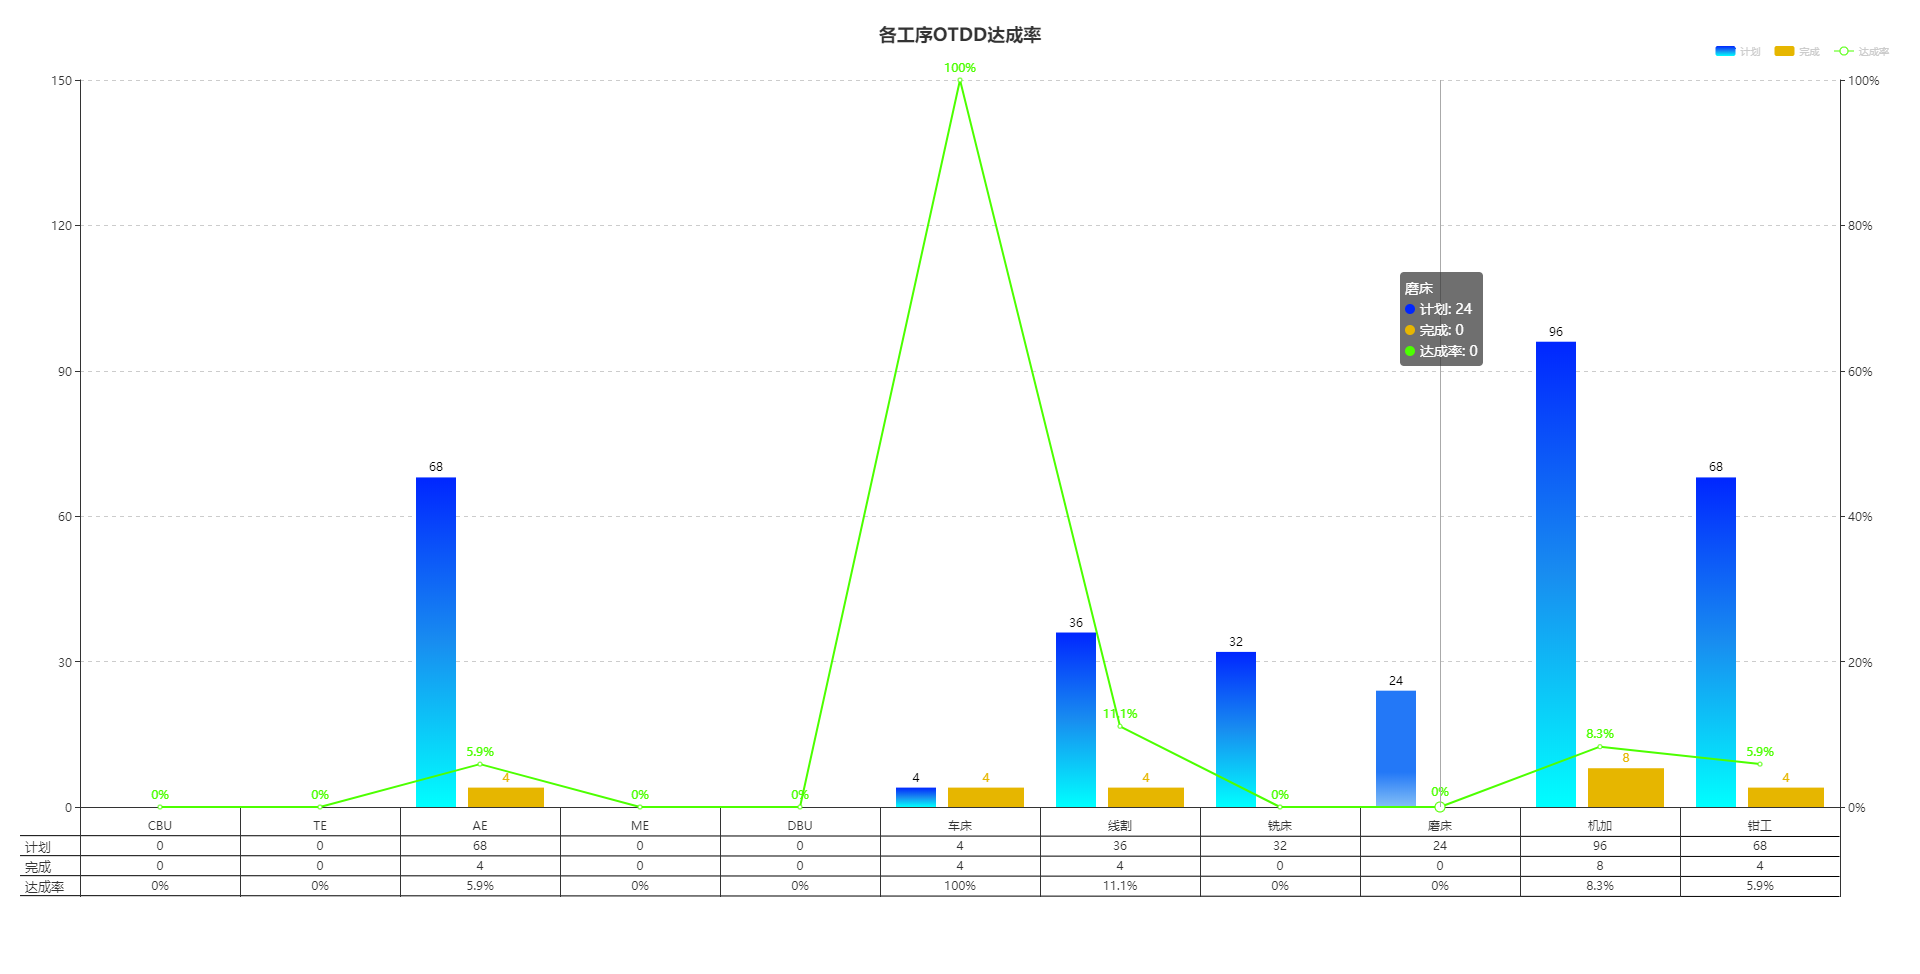
Echarts 底部加table

效果图


<!DOCTYPE html>
<html>
<head>
    <meta charset="utf-8" />
    <title>Echarts 底部加table</title>
    <script type="text/javascript" src="https://cdn.jsdelivr.net/npm/echarts@4/dist/echarts.min.js"></script>
    <style>
        html, body {
            height: 100%;
            margin:0px;
            
        }

        .chart {
            height: 90%;
            padding: 20px;
        }
    </style>
    <script>
        var chartCol;
        var data = [{ "Name": "CBU", "PlannedItems": 0, "CompletedItems": 0, "Completion_Rate": 0 }, { "Name": "TE", "PlannedItems": 0, "CompletedItems": 0, "Completion_Rate": 0 }, { "Name": "AE", "PlannedItems": 68, "CompletedItems": 4, "Completion_Rate": 5.9 }, { "Name": "ME", "PlannedItems": 0, "CompletedItems": 0, "Completion_Rate": 0 }, { "Name": "DBU", "PlannedItems": 0, "CompletedItems": 0, "Completion_Rate": 0 }, { "Name": "车床", "PlannedItems": 4, "CompletedItems": 4, "Completion_Rate": 100 }, { "Name": "线割", "PlannedItems": 36, "CompletedItems": 4, "Completion_Rate": 11.1 }, { "Name": "铣床", "PlannedItems": 32, "CompletedItems": 0, "Completion_Rate": 0 }, { "Name": "磨床", "PlannedItems": 24, "CompletedItems": 0, "Completion_Rate": 0 }, { "Name": "机加", "PlannedItems": 96, "CompletedItems": 8, "Completion_Rate": 8.3 }, { "Name": "钳工", "PlannedItems": 68, "CompletedItems": 4, "Completion_Rate": 5.9 }]

        window.onload = function(){
            initChartCol(data)
        }

        function getTableLine(num) {
            var list = [];
            var bottom = 60;//底部位置根据自己要求调整,我的理解是这的值应该设置 grid: { left: 60, right: 60, bottom: 90 }是90减30的一个值,
            var height = 20;
            for (var i = 0; i < num; i++) {
                list.push({
                    type: 'line',
                    bottom: bottom - i * height,
                    right: 60,
                    style: {
                        fill: '#fff',
                        /*stroke: 'blue'*/
                    },
                    shape: {
                        x1: 0,
                        y1: 0,
                        x2: 4200,
                        y2: 2
                    }

                });
            }
            return list;
        }
        var lineList = getTableLine(5);//要渲染几条线写几
        function initChartCol(data) {
            chart = echarts.init(document.getElementById('chartCol'), 'shine');
            var xa = [], ya = [], ya1 = [], ya2 = [], dt = ['计划', '完成', '达成率'];
            if (data == null)
                data = [];
            for (var i = 0; i < data.length; i++) {
                xa.push(data[i].Name);
                ya.push(data[i].PlannedItems);
                ya1.push(data[i].CompletedItems);
                ya2.push(data[i].Completion_Rate);
            }

            // 指定图表的配置项和数据
            var option = {
                title: [{
                    text: '各工序OTDD达成率',
                    x: 'center',
                    textStyle: { //设置主标题风格
                        /*color: '#00ffff',*///设置主标题字体颜色
                    }
                }, {
                    text: ' \n计划\n完成\n达成率',
                    bottom: -5,
                    left: 0,
                    textStyle: {
                        lineHeight: 20,
                        fontSize: 13,
                        /*color: "blue",*/
                        fontWeight: 'normal',
                        formatter: function (value) {
                            return '{table|' + value + '}';
                        },
                        rich: {
                            table: {
                                align: 'center'
                            }
                        }
                    }
                }],
                color: ['#e6b600', '#4cff00', '#c12e34', '#0098d9', '#2b821d', '#005eaa', '#339ca8', '#cda819', '#32a487'],
                backgroundColor: 'transparent',
                legend: {
                    top: '20px',
                    itemHeight: 10,
                    itemWidth: 20,
                    left: 'right',
                    textStyle: {//图例文字的样式
                        color: '#ccc',
                        fontSize: 10
                    },
                    data: dt
                },
                grid: { left: 60, right: 60, bottom: 90 },
                tooltip: {
                    trigger: 'axis',
                },
                xAxis: [
                    {
                        type: 'category',
                        data: xa,
                        axisTick: {
                            length: 90 // 竖线的长度
                        },
                        axisLine: {
                            lineStyle: {
                                type: 'solid',
                                /*color: 'blue'*/ // 更改坐标轴颜色
                            }
                        },
                        axisLabel: {
                            interval: 0,
                            axisPointer: {
                                type: 'shadow'
                            },
                            formatter: function (value, index) {
                                var indexNum = 0
                                for (var i = 0; i < xa.length; i++) {
                                    if (value === xa[i]) {
                                        indexNum = i
                                    }
                                }
                                return ('{table|' + value + '}\n{table|' + ya[indexNum] + '}\n{table|' + ya1[indexNum] + '}\n{table|' + ya2[indexNum] + '%}\n{table|' + '}')
                            },
                            rich: {
                                table: {
                                    lineHeight: 20,
                                    align: 'center'
                                }
                            }
                        }
                    }
                ],
                yAxis: [{
                    type: 'value',
                    boundaryGap: ['0%', '50%'],
                    axisLine: {
                        lineStyle: {
                            type: 'solid',
                            /*color: 'blue',*/ //左边线的颜色
                        }
                    },
                    splitLine: {
                        show: true,
                        lineStyle: {
                            type: 'dashed'
                        }
                    }

                }, {
                    type: 'value',
                    min: 0,
                    max: 100,
                    boundaryGap: ['0%', '20%'],
                    axisLine: {
                        lineStyle: {
                            type: 'solid',
                            /*color: 'blue',*/ //左边线的颜色
                        }
                    },
                    splitLine: {
                        show: false,
                        lineStyle: {
                            type: 'dashed'
                        }
                    },
                    axisLabel: {
                        formatter: '{value}%'
                    }
                }],
                graphic: lineList, //table
                series: [{
                    data: ya,
                    name: '计划',
                    type: 'bar',
                    yAxisIndex: 0,
                    label: {
                        show: true, position: 'top', formatter: function (params) {
                            if (params.value > 0) {
                                return params.value;
                            } else {
                                return '';
                            }
                        }
                    },
                    barMaxWidth: 40, // 最大宽度
                    itemStyle: {
                        normal: {
                            color: new echarts.graphic.LinearGradient(
                                0, 0, 0, 1,
                                [
                                    { offset: 0, color: '#0026ff' },
                                    { offset: 0.5, color: '#188df0' },
                                    { offset: 1, color: '#00ffff' }
                                ]
                            )
                        },
                        emphasis: {
                            color: new echarts.graphic.LinearGradient(
                                0, 0, 0, 1,
                                [
                                    { offset: 0, color: '#2378f7' },
                                    { offset: 0.7, color: '#2378f7' },
                                    { offset: 1, color: '#83bff6' }
                                ]
                            )
                        }
                    },
                }, {
                    data: ya1,
                    name: '完成',
                    type: 'bar',
                    label: {
                        show: true, position: 'top', formatter: function (params) {
                            if (params.value > 0) {
                                return params.value;
                            } else {
                                return '';
                            }
                        }
                    },
                },
                {
                    data: ya2,
                    name: '达成率',
                    type: 'line',
                    yAxisIndex: 1,
                    label: { normal: { show: true, position: 'top', formatter: '{c}%' } },
                }]
            };
            chart.clear();
            chart.setOption(option);
        }
    </script>
</head>
<body>
    <div class="chart" id="chartCol"></div>
</body>
</html>


posted @ 2021-05-06 15:58  StarFox  阅读(2403)  评论(0编辑  收藏  举报