python读取csv文件进行绘图
2023-06-19 https://www.cnblogs.com/NJ-Leon/
1. matplotlib 库安装
升级 pip :
python3 -m pip install -U pip
安装 matplotlib 库:
python3 -m pip install -U matplotlib
2. python 代码
import csv
import matplotlib.pyplot as plt

file_path = "D:/tmp/000_csv_draw/test_2023-06-16_1.csv"

with open(file_path, "r") as f:         # 打开csv文件
    reader = csv.reader(f)              # 读取csv文件
    list_data = list(reader)            # csv数据转换为列表
    f.close()

rows = len(list_data)                   # 行数
cols = len(list_data[0])                # 列数
print("rows =", rows)
print("cols =", cols)

# 最多支持3列数据绘图,可自行扩展
col_0 = []
col_1 = []
col_2 = []

if (cols > 2):
    for i in range(0, rows):
        col_2.append(list_data[i][2])
        col_1.append(list_data[i][1])
        col_0.append(list_data[i][0])
elif (cols > 1):
    for i in range(0, rows):
        col_1.append(list_data[i][1])
        col_0.append(list_data[i][0])
else:
    for i in range(0, rows):
        col_0.append(list_data[i][0])

data_col_0=[int(x) for x in col_0]      # 0列数据
data_col_1=[int(x) for x in col_1]      # 1列数据
data_col_2=[int(x) for x in col_2]      # 2列数据

if (cols > 2):
    plt.subplot(311)
    plt.plot(data_col_0)
    plt.subplot(312)
    plt.plot(data_col_1)
    plt.subplot(313)
    plt.plot(data_col_2)
elif (cols > 1):
    plt.subplot(211)
    plt.plot(data_col_0)
    plt.subplot(212)
    plt.plot(data_col_1)
else:
    plt.plot(data_col_0)
    # plt.title("graph")
    # plt.xlabel("points", loc = "right")
    # plt.ylabel("data", loc = "top")
plt.show()
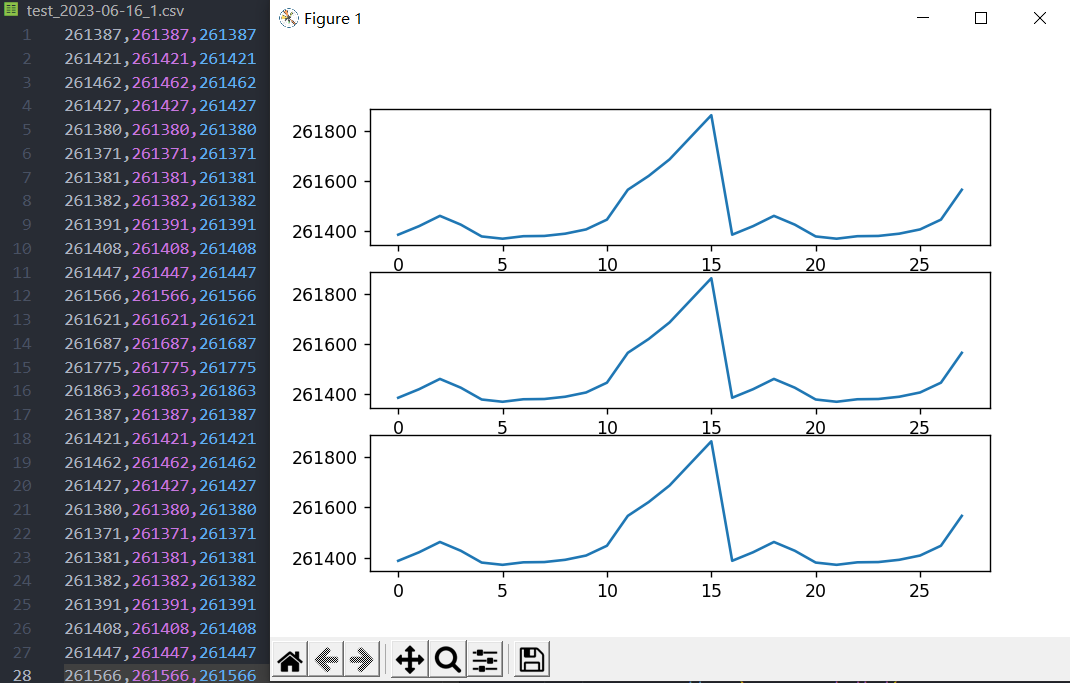
3. 运行效果


