编写SpringBoot自定义Prometheus监控指标
一、简介
Prometheus是由SoundCloud开发的开源监控报警系统。Prometheus使用Go语言开发,是Google BorgMon监控系统的开源版本,2016年被正式由Google发起的Linux基金会旗下的原生云基金会(CNCF)纳入管理。截止目前为止,Prometheus在GitHub上已经吸引了28K+的关注度,已成为仅此于Kubernetes的第二大核心开源项目。项目地址:https://github.com/prometheus/prometheus
二、架构分析
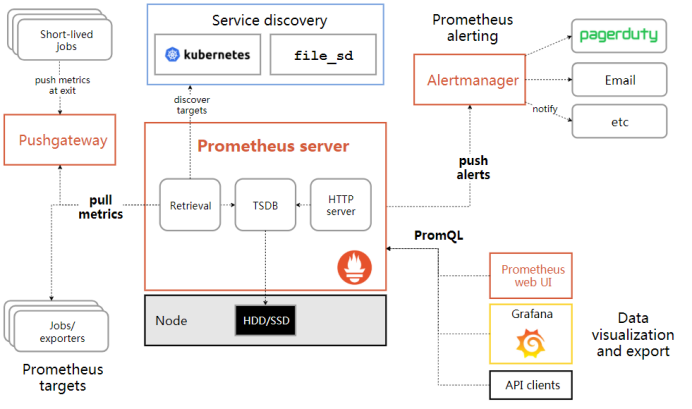
如图,以下就是Prometheus官方提供的架构图,我们的一个个Spring应用就对应该图左下角的Prometheus targets。通常情况下,每一个Spring应用启动时,都会带着一个Prometheus Export组件一同启动,而这个Export组件则专门用来收集和暴露Spring业务进程的监控数据;默认情况下,Prometheus Server会每隔30秒拉取一次各个target收集到的监控数据,然后将数据保存在时序数据库中,等待用户通过PromQL语句进行查询,最终将查询出来的相关监控数据展现在Grafana监控面板中。
三、问题
我们知道,监控指标一般按“硬件级别”、“系统级别”和“应用级别”三个维度去划分;其中“硬件级别”一般包括CPU、内存、硬盘、带宽等指标,“系统级别”(我们以Java应用为例)一般包括堆内存(更细可按Eden区、Survivor区、老年代等等划分)、非堆内存、线程、日志、GC等指标;而“应用级别”则一般指业务系统的接口、方法和变量等相关的状态指标。
从上面的架构图来看,我们可以了解到 Prometheus的监控数据均来自“安插”在被监控目标的Export程序,而Prometheus官方也已经为我们提供了众多的Export,比如监控主机状态的Node_Export就可以很好的满足我们对“硬件级别”的监控需求,再比如官方提供的Java_Client和JMX_Export,它们则可以方便的为我们提供Java进程“系统级别”的监控需求;但遗憾的是,Prometheus并没有为我们提供“应用级别”的监控指标收集程序。退一步讲,Prometheus也没有办法为我们提供这样收集程序(Prometheus怎么知道你的应用系统是用的什么语言什么技术实现的呢?)。但是当我们需要对应用系统进行性能评估、访问统计或者是问题排查时,很多系统内部的一些调用情况和各种状态信息对我们又很重要,比如某些方法的执行次数、方法执行的错误次数、N秒内方法执行的平均/最大耗时等等。既然Prometheus并没有为我们提供这些监控指标,那么我们就自己动手来开发几个常用的方法级监控指标。
值得一提的是,SpringBoot主要是通过自带的actuator监控平台和Micrometer将被监控的数据指标收集、暴露出来的;而基于Tomcat的SpringMVC应用则需要借助官方提供的JMX_Export(通过收集MBean暴露的数据实现) 插件来暴露和收集监控指标。后者的开发难度比前者要稍大一些(甚至需要对JMX_Export的部分源码进行调整),我们这里先抛开不谈,不过相关的内容我会在我另一篇文章中做详细说明,感兴趣的童鞋可以在那里做进一步的了解。
四、自定义监控指标开发
目标:这一节我将以SpringBoot项目为例,并基于SpringAOP去开发一些我们自定义的监控指标(比如:各个方法执行总次数、方法执行总错误次数和方法执行的平均耗时)。然后将这些自定义监控指标封装到一个切面中,并发布为一个独立的项目模块,当有项目希望接入这些自定义监控指标时,只需要将我们发布的自定义指标项目模块添加到pom.xml中,然后配置扫描指定的路径并打开Prometheus监控开关即可实现自定义监控指标的“无侵入式”接入。期间我会在第二步中结合少量源码着重介绍各种度量类API的使用,以及几种常用的度量类注册中心(MeterRegistry)。
第一步:
IDEA新建SpringBoot根模块custom-prome(SpringBoot 2.1.4);
在custom-prome中分别新建模块custom-prome-springboot 和模块custom-prome-test,其中custom-prome-springboot模块用于切面封装和发布,custom-prome-test模块用于测试;
custom-prome-springboot的pom.xml添加相关依赖,内容如下:
<?xml version="1.0" encoding="UTF-8"?>
<project xmlns="http://maven.apache.org/POM/4.0.0"
         xmlns:xsi="http://www.w3.org/2001/XMLSchema-instance"
         xsi:schemaLocation="http://maven.apache.org/POM/4.0.0 http://maven.apache.org/xsd/maven-4.0.0.xsd">
    <parent>
        <artifactId>custom-prome</artifactId>
        <groupId>com.custom.prome</groupId>
        <version>0.0.1-SNAPSHOT</version>
    </parent>
    <modelVersion>4.0.0</modelVersion>

    <groupId>com.custom.prome</groupId>
    <artifactId>custom-prome-springboot</artifactId>
    <version>0.0.1-SNAPSHOT</version>

    <dependencies>
         <!--springboot aop 功能包-->
        <dependency>
            <groupId>org.springframework.boot</groupId>
            <artifactId>spring-boot-starter-aop</artifactId>
        </dependency>
        <!-- springboot 内置收集系统数据功能包-->
        <dependency>
            <groupId>org.springframework.boot</groupId>
            <artifactId>spring-boot-starter-actuator</artifactId>
        </dependency>
        <!-- prometheus 收集数据功能包-->
        <dependency>
            <groupId>io.micrometer</groupId>
            <artifactId>micrometer-registry-prometheus</artifactId>
        </dependency>
    </dependencies>
</project>
第二步:编写切面类
package com.custom.prome.aspect;


import io.micrometer.core.instrument.Counter;
import io.micrometer.core.instrument.Metrics;
import io.micrometer.core.instrument.Timer;
import org.aspectj.lang.ProceedingJoinPoint;
import org.aspectj.lang.annotation.Around;
import org.aspectj.lang.annotation.Aspect;
import org.aspectj.lang.annotation.Pointcut;
import org.aspectj.lang.reflect.MethodSignature;

import java.lang.reflect.Method;

@Aspect
public class MicrometerAspect {
    /**
     * 控制器切入点
     */
    @Pointcut("execution(public * com.custom.prome..controller.*.*(..))")
    public void controllerCutPoint(){}
    /**
     * 服务层切入点
     */
    @Pointcut("execution(public * com.custom.prome..service.*.*(..))")
    public void serviceCutPoint(){}
    /**
     * 持久层切入点
     */
    @Pointcut("execution(public * com.custom.prome..dao.*.*(..))")
    public void daoCutPoint(){}
    /**
     * 排斥切入点1
     */
    @Pointcut("!execution(public * com.custom.prome.config.PromeJavaConfig.*(..))")
    public void cutPointExclude1(){}
    /**
     * 排除切入点2
     */
    @Pointcut("!execution(public * io.micrometer.core.instrument.binder.MeterBinder+.*(..))")
    public void cutPointExclude2(){}
    /**
     * 环绕通知
     */
    @Around("(controllerCutPoint() || serviceCutPoint() || daoCutPoint())&& cutPointExclude1() && cutPointExclude2()")
    public Object around(ProceedingJoinPoint joinPoint) throws Throwable {
        MethodSignature methodSignature = (MethodSignature) joinPoint.getSignature();
        Method method = methodSignature.getMethod();
        Class declaringType = methodSignature.getDeclaringType();
        String packageName= declaringType.getPackage().getName();
        String layer = packageName.substring(packageName.lastIndexOf(".")+1);

        //方法执行时长
        Timer timer = Metrics.timer("method.cost.time", "method.layer",layer,"method.name", method.getName());
        //方法执行次数
        Counter execCount = Metrics.counter("exec.count", "method.layer",layer,"method.name", method.getName());
        //方法执行异常次数
        Counter execErrorCount = Metrics.counter("exec.error.count", "method.layer",layer,"method.name", method.getName());

        InnerThrowable innerThrowable = new InnerThrowable();
        Object result = timer.recordCallable(() -> {
            try {
                execCount.increment();
                return joinPoint.proceed();
            } catch (Throwable e) {
                innerThrowable.throwable = e;
            }
            return null;
        });
        if (innerThrowable.throwable != null) {
            execErrorCount.increment();
            throw innerThrowable.throwable;
        }
        return result;
    }

    private class InnerThrowable {
        Throwable throwable;
    }
}
重要说明:这里需要重点关注一下该切面中使用到的micrometer包中提供的Metrics工厂类以及相关的一些API。在SpringBoot2.X中,我们通过spring-boot-starter-actuator依赖引入了io.micrometer,相比于SpringBoo1.X,micrometer对metrics进行了重构,主要支持了tag/label,使得我们可以更加方便地配合Prometheus的tag/label对metrics进行多维度的统计查询及监控。io.micrometer目前主要支持Counter/FunctionCounter、Gauge/TimeGauge、Timer/FunctionTimer/LongTaskTimer、Summary/DistributionSummary等多种不同类型的度量方式。这里先简单介绍一下最常用的Counter、Gauge、Timer和Summary几个类型度量类的使用场景:
Counter:计数器,简单理解就是一种只增不减的计数器。它通常用于记录服务的请求数量、完成的任务数量、错误的发生数量等等;
Gauge:仪表,这是一个表示单个数值的度量,它可以表示任意地上下移动的数值测量。它通常用于变动的测量值,如当前的内存使用情况,同时也可以测量上下移动的"计数",比如队列中的消息数量;
Timer:计时器,用于测量一个特定的代码逻辑块的单次调用耗时、总调用耗时、最大耗时等等。一般用于记录整个方法执行的总时间、测量短时间执行的事件的耗时分布,例如消息队列消息的消费速率;
Summary:摘要,用于跟踪事件的分布。它类似于一个计时器,但更一般的情况是,它的大小并不一定是一段时间的测量值。在micrometer中,对应的类是DistributionSummary,它的用法有点像Timer,但是记录的值是需要直接指定,而不是通过测量一个任务的执行时间。Summary的度量统计角度主要包括记录过的数据中的最大值、总数值、平均值和总次数。另外,一些度量属性(如下限和上限)或者单位可以自行配置,具体属性的相关内容可以查看DistributionStatisticConfig类,这里不详细展开。
如想更加深入地研究各种度量类型可根据官网提供的文档自行尝试和学习:https://micrometer.io/docs/concepts
此外,还要说明的一点就是Counter、Gauge、Timer和Summary这几个类型度量类都实现自一个共同的接口Meter,该接口是Micrometer收集度量数据的标准接口,而各种Meter实现类中的数据又是由MeterRegistry创建和保存的,一般情况下,每个SpringBoot进程启动后,都需要创建一个MeterRegistry对象,然后各种Meter对象就会把自己注册到该注册中心,从而保存收集到的各种监控数据。Micrometer其实已经为我们内置了几种常用的注册中心实现类,比如有:SimpleMeterRegistry、CompositeMeterRegistry还有通过工厂类io.micrometer.core.instrument.Metrics生成的全局MeterRegistry对象,当然我们也可以继承MeterRegistry去实现自定义的MeterRegistry。
事实上,我们上面自己开发的切面类使用的正是我们说的第三种---通过工厂类io.micrometer.core.instrument.Metrics生成的全局的MeterRegistry对象。这种MeterRegistry是最简单易用的一种注册中心,当SpringBoot应用启动时,Micrometer会自动向Spring上下文中注入一个CompositeMeterRegistry对象,然后我们只需要使用Metrics类中提供的各种静态方法即可完成各种度量对象的注册和数据存储。举个例子,比如说我们上面的Counter execCount = Metrics.counter("exec.count", "method.layer",layer,"method.name", method.getName());这句代码,它的调用链路如下:
public class Metrics{
  //这就是上面说的那个全局注册中心对象
public static final CompositeMeterRegistry globalRegistry = new CompositeMeterRegistry();
...
  public static Counter counter(String name, String... tags) {
      return globalRegistry.counter(name, tags);
  }
  ...
}
↓
public abstract class MeterRegistry{
  ...
  public Counter counter(String name, String... tags) {
      return counter(name, Tags.of(tags));
  }
  ...
}
↓
public abstract class MeterRegistry{
  ...
  public Counter counter(String name, Iterable<Tag> tags) {
    //理解这个地方的this很关键哦
      return Counter.builder(name).tags(tags).register(this);
  }
  ...
}
↓
public interface Counter extends Meter{
  ...
  public Counter register(MeterRegistry registry) {
      return registry.counter(new Meter.Id(name, tags, baseUnit, description, Type.COUNTER));
  }
  ...
}
从源码的调用链路我们不难发现,当我们调用Metrics中静态方法counter时,其实就已经把一个度量对象注册到了内置的全局MeterRegistry(也就是CompositeMeterRegistry注册中心)啦。
至于其他的注册中心,我这里就不一一剖析啦,感兴趣的童鞋建议去研究一下源码哦
第三步:编写Java配置类
package com.custom.prome.config;


import com.custom.prome.aspect.MicrometerAspect;
import com.custom.prome.util.PromeUtils;
import io.micrometer.core.instrument.MeterRegistry;
import org.springframework.beans.factory.annotation.Value;
import org.springframework.boot.actuate.autoconfigure.metrics.MeterRegistryCustomizer;
import org.springframework.context.annotation.Bean;
import org.springframework.context.annotation.Configuration;

import java.net.InetAddress;
import java.net.UnknownHostException;

@Configuration
public class PromeJavaConfig {

    @Bean
    public MeterRegistryCustomizer<MeterRegistry> configurer(@Value("${spring.application.name}") String applicationName) {
        return registry -> {
            try {
                registry.config().commonTags("application", PromeUtils.strIsEmpty(applicationName) ?"none":applicationName,"hostname", InetAddress.getLocalHost().getHostName());
            } catch (UnknownHostException e) {
                e.printStackTrace();
            }
        };
    }

    @Bean
    public MicrometerAspect micrometerAspect(){
        return new MicrometerAspect();
    }
}
说明:以上三步我们就可以开发出一个简易的自定义监控指标切面了,下面我们只需要在需要接入自定义监控指标的地方添加扫描该配置类,当项目启动时该切面就会自动被实例化并开始工作啦
第四步:编写测试模块custom-prome-test。
①在测试模块中添加custom-prome-springboot模块依赖,pom.xml内容如下:
 1 <?xml version="1.0" encoding="UTF-8"?>
 2 <project xmlns="http://maven.apache.org/POM/4.0.0" xmlns:xsi="http://www.w3.org/2001/XMLSchema-instance"
 3          xsi:schemaLocation="http://maven.apache.org/POM/4.0.0 https://maven.apache.org/xsd/maven-4.0.0.xsd">
 4     <modelVersion>4.0.0</modelVersion>
 5
 6     <parent>
 7         <artifactId>custom-prome</artifactId>
 8         <groupId>com.custom.prome</groupId>
 9         <version>0.0.1-SNAPSHOT</version>
10     </parent>
11
12     <groupId>com.custom.prome</groupId>
13     <artifactId>custom-prome-test</artifactId>
14     <version>0.0.1-SNAPSHOT</version>
15     <name>custom-prome-test</name>
16
17     <properties>
18         <java.version>1.8</java.version>
19     </properties>
20
21     <dependencies>
22         <dependency>
23             <groupId>org.springframework.boot</groupId>
24             <artifactId>spring-boot-starter-web</artifactId>
25         </dependency>
26
27         <dependency>
28             <groupId>com.custom.prome</groupId>
29             <artifactId>custom-prome-springboot</artifactId>
30             <version>0.0.1-SNAPSHOT</version>
31         </dependency>
32     </dependencies>
33
34     <build>
35         <finalName>prome-test</finalName>
36         <plugins>
37             <plugin>
38                 <artifactId>maven-compiler-plugin</artifactId>
39                 <version>2.3.2</version>
40                 <configuration>
41                     <source>1.8</source>
42                     <target>1.8</target>
43                     <encoding>UTF-8</encoding>
44                     <failOnError>true</failOnError>
45                     <verbose>false</verbose>
46                     <fork>false</fork>
47                 </configuration>
48             </plugin>
49             <plugin>
50                 <groupId>org.springframework.boot</groupId>
51                 <artifactId>spring-boot-maven-plugin</artifactId>
52                 <configuration>
53                     <mainClass>com.custom.prome.CustomPromeTestApplication</mainClass>
54                 </configuration>
55                 <executions>
56                     <execution>
57                         <goals>
58                             <goal>repackage</goal>
59                         </goals>
60                     </execution>
61                 </executions>
62             </plugin>
63         </plugins>
64     </build>
65
66 </project>
②在启动类上添加包扫描并开启web功能:
@EnableWebMvc
@ComponentScan(basePackages = "com.custom.prome.*")
③配置文件中添加开启Prometheus监控配置:
spring.application.name=prometest
management.security.enabled=false
management.metrics.export.prometheus.enabled=true
management.metrics.export.prometheus.step=1m
management.metrics.export.prometheus.descriptions=true
management.web.server.auto-time-requests=true
management.endpoints.prometheus.id=springmetrics
management.endpoints.web.exposure.include=health,info,env,prometheus,metrics,httptrace,threaddump,heapdump,springmetrics
④编写一个简单的Controller测试类:
package com.custom.prome.controller;

import com.custom.prome.service.TestService;
import org.springframework.beans.factory.annotation.Autowired;
import org.springframework.web.bind.annotation.RequestMapping;
import org.springframework.web.bind.annotation.RequestParam;
import org.springframework.web.bind.annotation.RestController;

import java.util.List;
import java.util.concurrent.atomic.AtomicLong;

@RestController
@RequestMapping("/hello")
public class Hello {

    @Autowired
    private TestService service;
   //请求计数器
    private final AtomicLong count = new AtomicLong(0);

    @RequestMapping("get")
    public String getCount() {
     //用于测试请求异常次数
        int i = 1/0;
        return ""+count.intValue();
    }

    @RequestMapping("add")
    public String addCount() {
        count.incrementAndGet();
        return ""+count.intValue();
    }

    @RequestMapping("reset")
    public String reset() {
        count.set(0);
        return ""+count.intValue();
    }

    @RequestMapping("list")
    public List<String> list(@RequestParam int a){
        return service.getList();
    }
}
注:TestService 类已省略,可自行编写一个简单实现类
第五步:启动测试类,先访问几次测试接口,然后访问http://localhost:8080/actuator/prometheus,即可看到自定义监控指标
# HELP exec_error_count_total
# TYPE exec_error_count_total counter
exec_error_count_total{application="prometest",hostname="xxx-PC",method_layer="dao",method_name="getList",} 0.0
exec_error_count_total{application="prometest",hostname="xxx-PC",method_layer="controller",method_name="list",} 0.0
exec_error_count_total{application="prometest",hostname="xxx-PC",method_layer="dao",method_name="isListEmpty",} 0.0
exec_error_count_total{application="prometest",hostname="xxx-PC",method_layer="controller",method_name="setAlarm",} 0.0
exec_error_count_total{application="prometest",hostname="xxx-PC",method_layer="service",method_name="getList",} 0.0
exec_error_count_total{application="prometest",hostname="xxx-PC",method_layer="controller",method_name="getAlarm",} 0.0
# HELP method_cost_time_seconds
# TYPE method_cost_time_seconds summary
method_cost_time_seconds_count{application="prometest",hostname="xxx-PC",method_layer="dao",method_name="getList",} 1.0
method_cost_time_seconds_sum{application="prometest",hostname="xxx-PC",method_layer="dao",method_name="getList",} 5.9258E-5
method_cost_time_seconds_count{application="prometest",hostname="xxx-PC",method_layer="controller",method_name="list",} 1.0
method_cost_time_seconds_sum{application="prometest",hostname="xxx-PC",method_layer="controller",method_name="list",} 0.009757557
method_cost_time_seconds_count{application="prometest",hostname="xxx-PC",method_layer="dao",method_name="isListEmpty",} 1.0
method_cost_time_seconds_sum{application="prometest",hostname="xxx-PC",method_layer="dao",method_name="isListEmpty",} 0.003560664
method_cost_time_seconds_count{application="prometest",hostname="xxx-PC",method_layer="controller",method_name="setAlarm",} 1.0
method_cost_time_seconds_sum{application="prometest",hostname="xxx-PC",method_layer="controller",method_name="setAlarm",} 0.003267136
method_cost_time_seconds_count{application="prometest",hostname="xxx-PC",method_layer="service",method_name="getList",} 1.0
method_cost_time_seconds_sum{application="prometest",hostname="xxx-PC",method_layer="service",method_name="getList",} 0.008954402
method_cost_time_seconds_count{application="prometest",hostname="xxx-PC",method_layer="controller",method_name="getAlarm",} 1.0
method_cost_time_seconds_sum{application="prometest",hostname="xxx-PC",method_layer="controller",method_name="getAlarm",} 0.006443014
# HELP method_cost_time_seconds_max
# TYPE method_cost_time_seconds_max gauge
method_cost_time_seconds_max{application="prometest",hostname="xxx-PC",method_layer="dao",method_name="getList",} 5.9258E-5
method_cost_time_seconds_max{application="prometest",hostname="xxx-PC",method_layer="controller",method_name="list",} 0.009757557
method_cost_time_seconds_max{application="prometest",hostname="xxx-PC",method_layer="dao",method_name="isListEmpty",} 0.003560664
method_cost_time_seconds_max{application="prometest",hostname="xxx-PC",method_layer="controller",method_name="setAlarm",} 0.003267136
method_cost_time_seconds_max{application="prometest",hostname="xxx-PC",method_layer="service",method_name="getList",} 0.008954402
method_cost_time_seconds_max{application="prometest",hostname="xxx-PC",method_layer="controller",method_name="getAlarm",} 0.006443014
# HELP exec_count_total
# TYPE exec_count_total counter
exec_count_total{application="prometest",hostname="xxx-PC",method_layer="dao",method_name="getList",} 1.0
exec_count_total{application="prometest",hostname="xxx-PC",method_layer="controller",method_name="list",} 1.0
exec_count_total{application="prometest",hostname="xxx-PC",method_layer="dao",method_name="isListEmpty",} 1.0
exec_count_total{application="prometest",hostname="xxx-PC",method_layer="controller",method_name="setAlarm",} 1.0
exec_count_total{application="prometest",hostname="xxx-PC",method_layer="service",method_name="getList",} 1.0
exec_count_total{application="prometest",hostname="xxx-PC",method_layer="controller",method_name="getAlarm",} 1.0
以上不难看出,红色部分就是各个方法调用异常次数数据,蓝色部分和绿色是各个方法条用总次数,橙色部分是各个方法调用总耗时,紫色部分是各个方法调用最大耗时。拿到这些数据后我们就通过Prometheus提供的PromQL语句轻松地将方法调用次数、错误次数以及方法平均耗时(需要结合Prometheus的内置函数进行二次计算)查询出来啦
五、总结
如果你想开发一些通用型的监控指标,比如监控某一类方法或某一类接口的调用总次数,则通常的做法就是采用“过滤器”、“拦截器”或者“AOP”这样具备拦截功能的方法去实现。但我的建议是,如果不是万不得已,我不太推荐使用“过滤器”去做这样的事情,因为我认为它太过底层或者说太重了,而且在过滤器中,我们也不太方便去利用上层框架中已经封装好的一些内置对象;所以如果你想开发Http接口的监控指标,则建议你使用拦截器去做;如果你想开发方法的监控指标,那么则建议你使用AOP去做【只是个人理解,方法不唯一】
该项目源码我已上传至个人GitHub上,如有需要您可以下载项目源码本地运行观察效果。链接:https://github.com/JCACJY/custom-prome.git

 浙公网安备 33010602011771号