
zabbix6.4+grafana10.1监控可视化
一、安装grafana
yum install -y https://dl.grafana.com/enterprise/release/grafana-enterprise-10.1.4-1.x86_64.rpm
二、启动并设为开机自启
[root@zabbix-server ~]#  systemctl start grafana-server.service
[root@zabbix-server ~]#  systemctl enable grafana-server.service
Synchronizing state of grafana-server.service with SysV service script with /usr/lib/systemd/systemd-sysv-install.
Executing: /usr/lib/systemd/systemd-sysv-install enable grafana-server
Created symlink /etc/systemd/system/multi-user.target.wants/grafana-server.service → /usr/lib/systemd/system/grafana-server.service.

[root@zabbix-server ~]# ss -ntulp | grep 3000
tcp   LISTEN 0      2048               *:3000             *:*    users:(("grafana",pid=5156,fd=9))
三、防火墙开放相关端口
[root@zabbix-server ~]# firewall-cmd --add-service=grafana --permanent
success

[root@zabbix-server ~]# systemctl restart firewalld

[root@zabbix-server ~]# firewall-cmd  --list-all
public (active)
  target: default
  icmp-block-inversion: no
  interfaces: ens160 ens192
  sources:
  services: cockpit dhcpv6-client grafana http https ssh zabbix-agent zabbix-server
  ports:
  protocols:
  forward: no
  masquerade: no
  forward-ports:
  source-ports:
  icmp-blocks:
  rich rules:
四、使用web界面登录
默认账户密码:admin admin
第一次登录需要修改密码

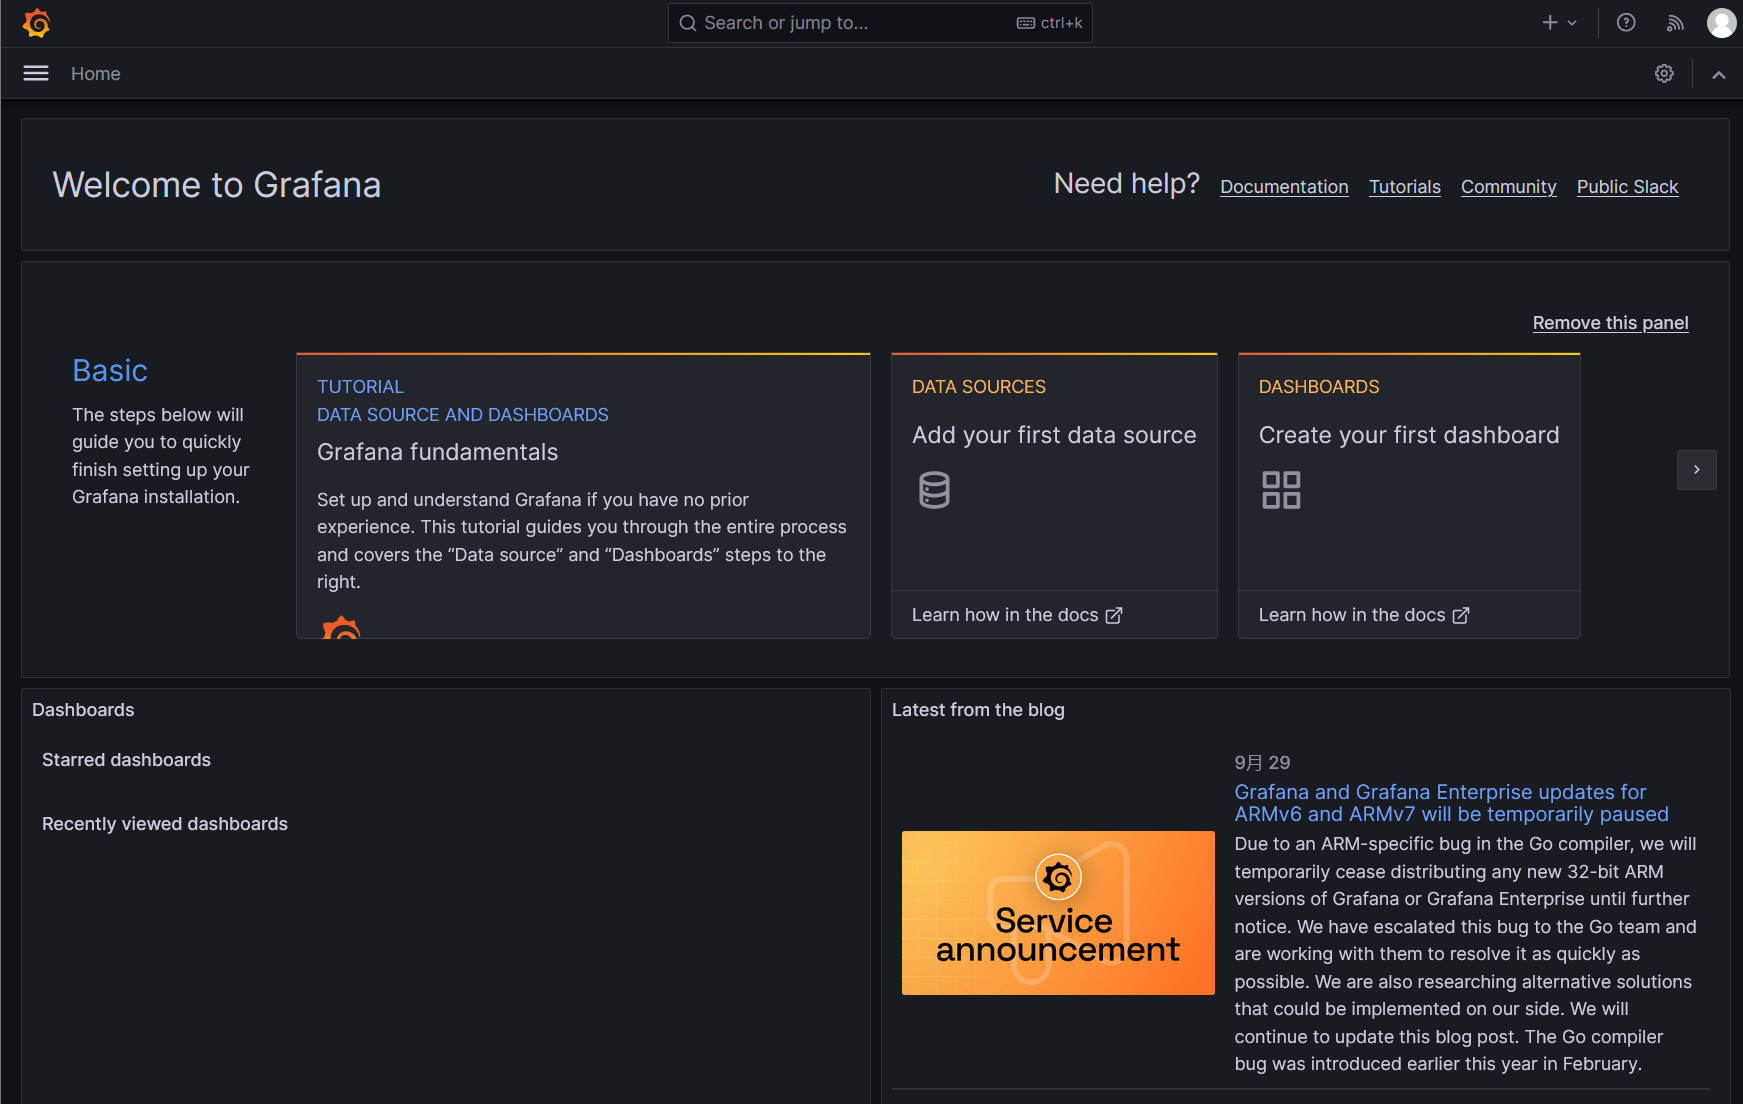
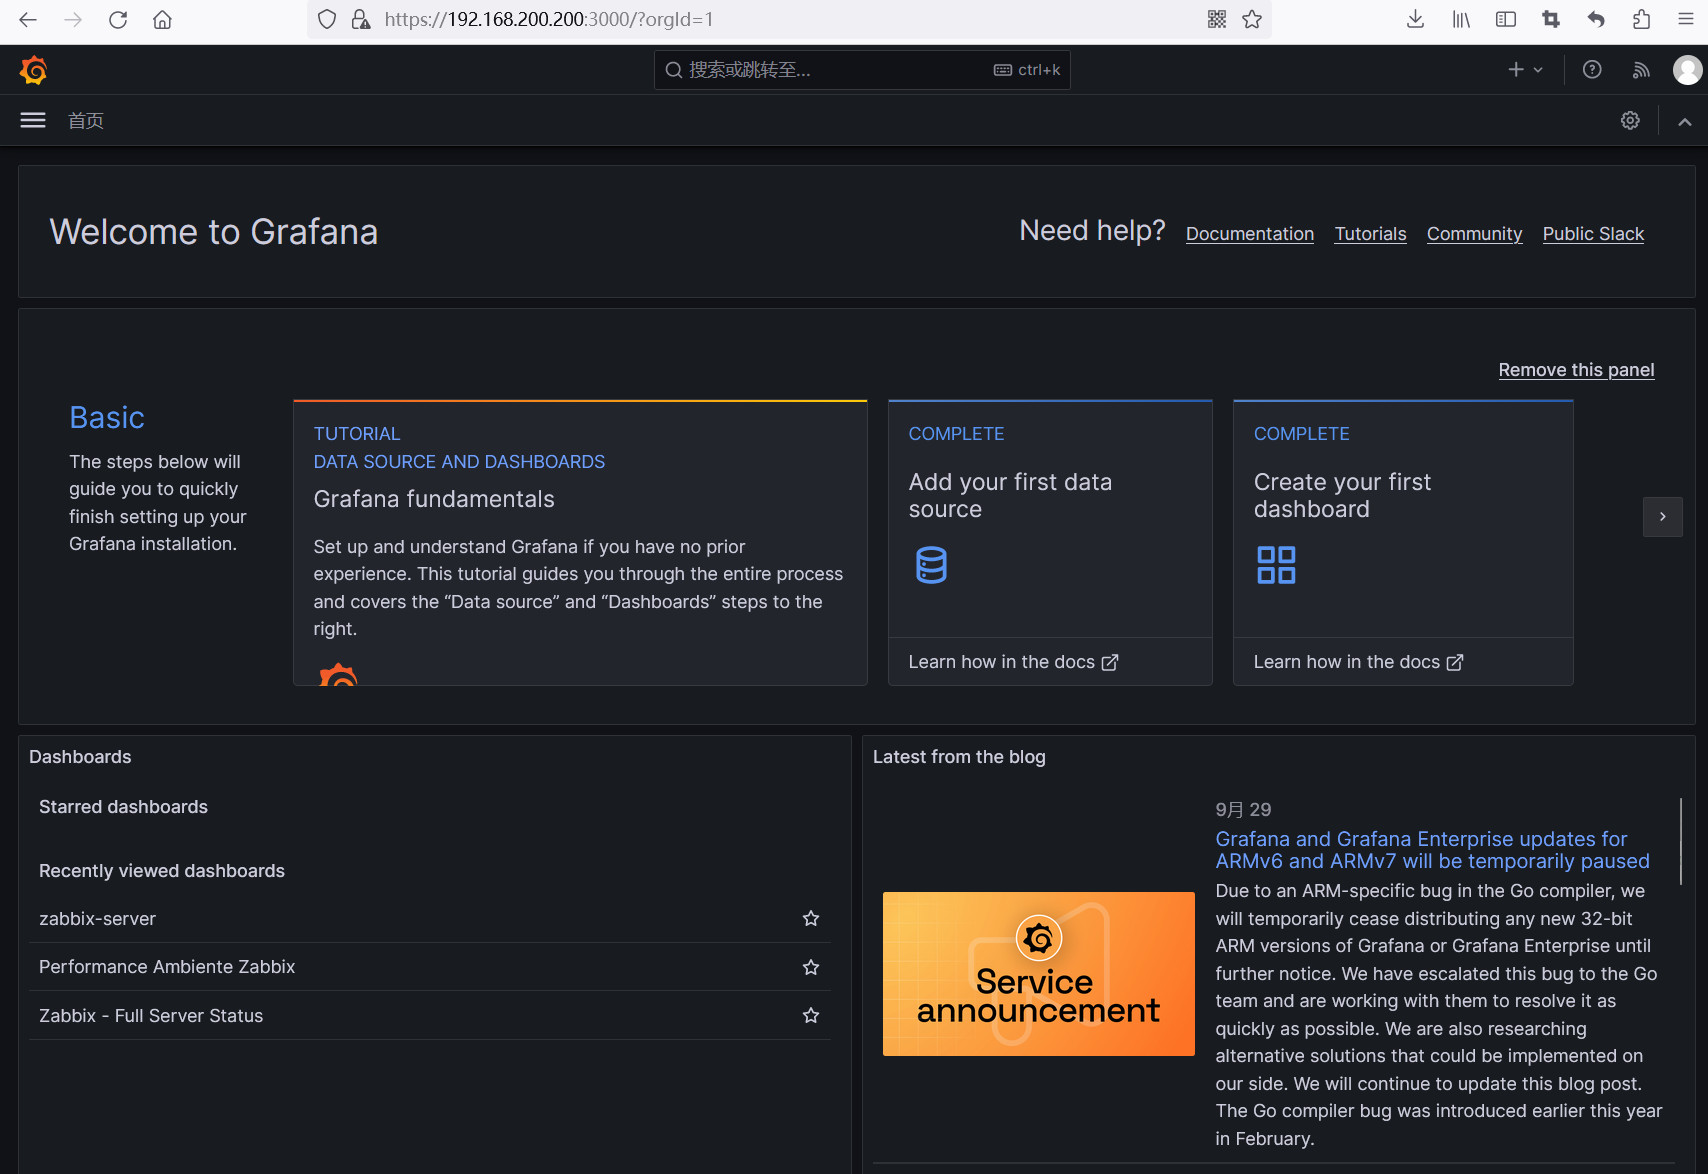
登录进来后显示该页面
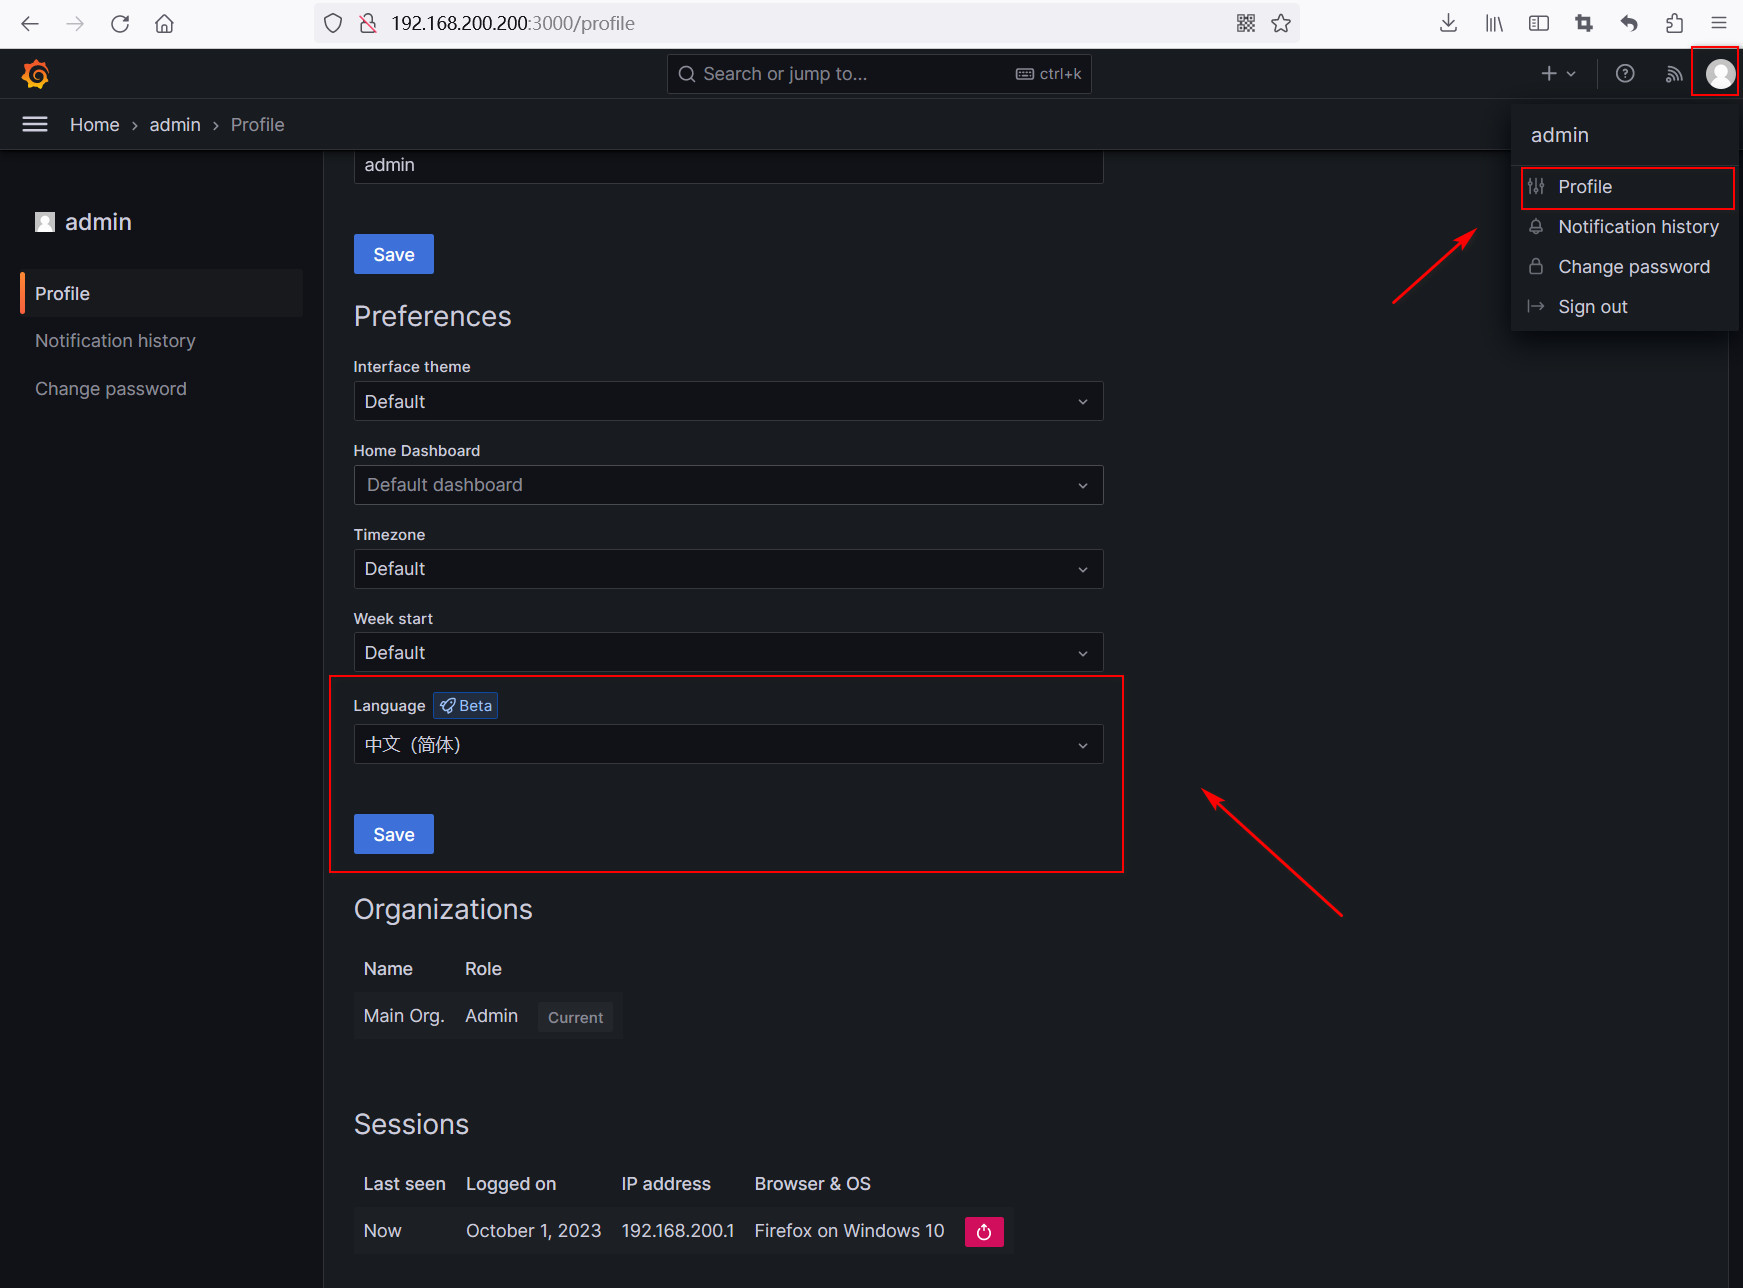
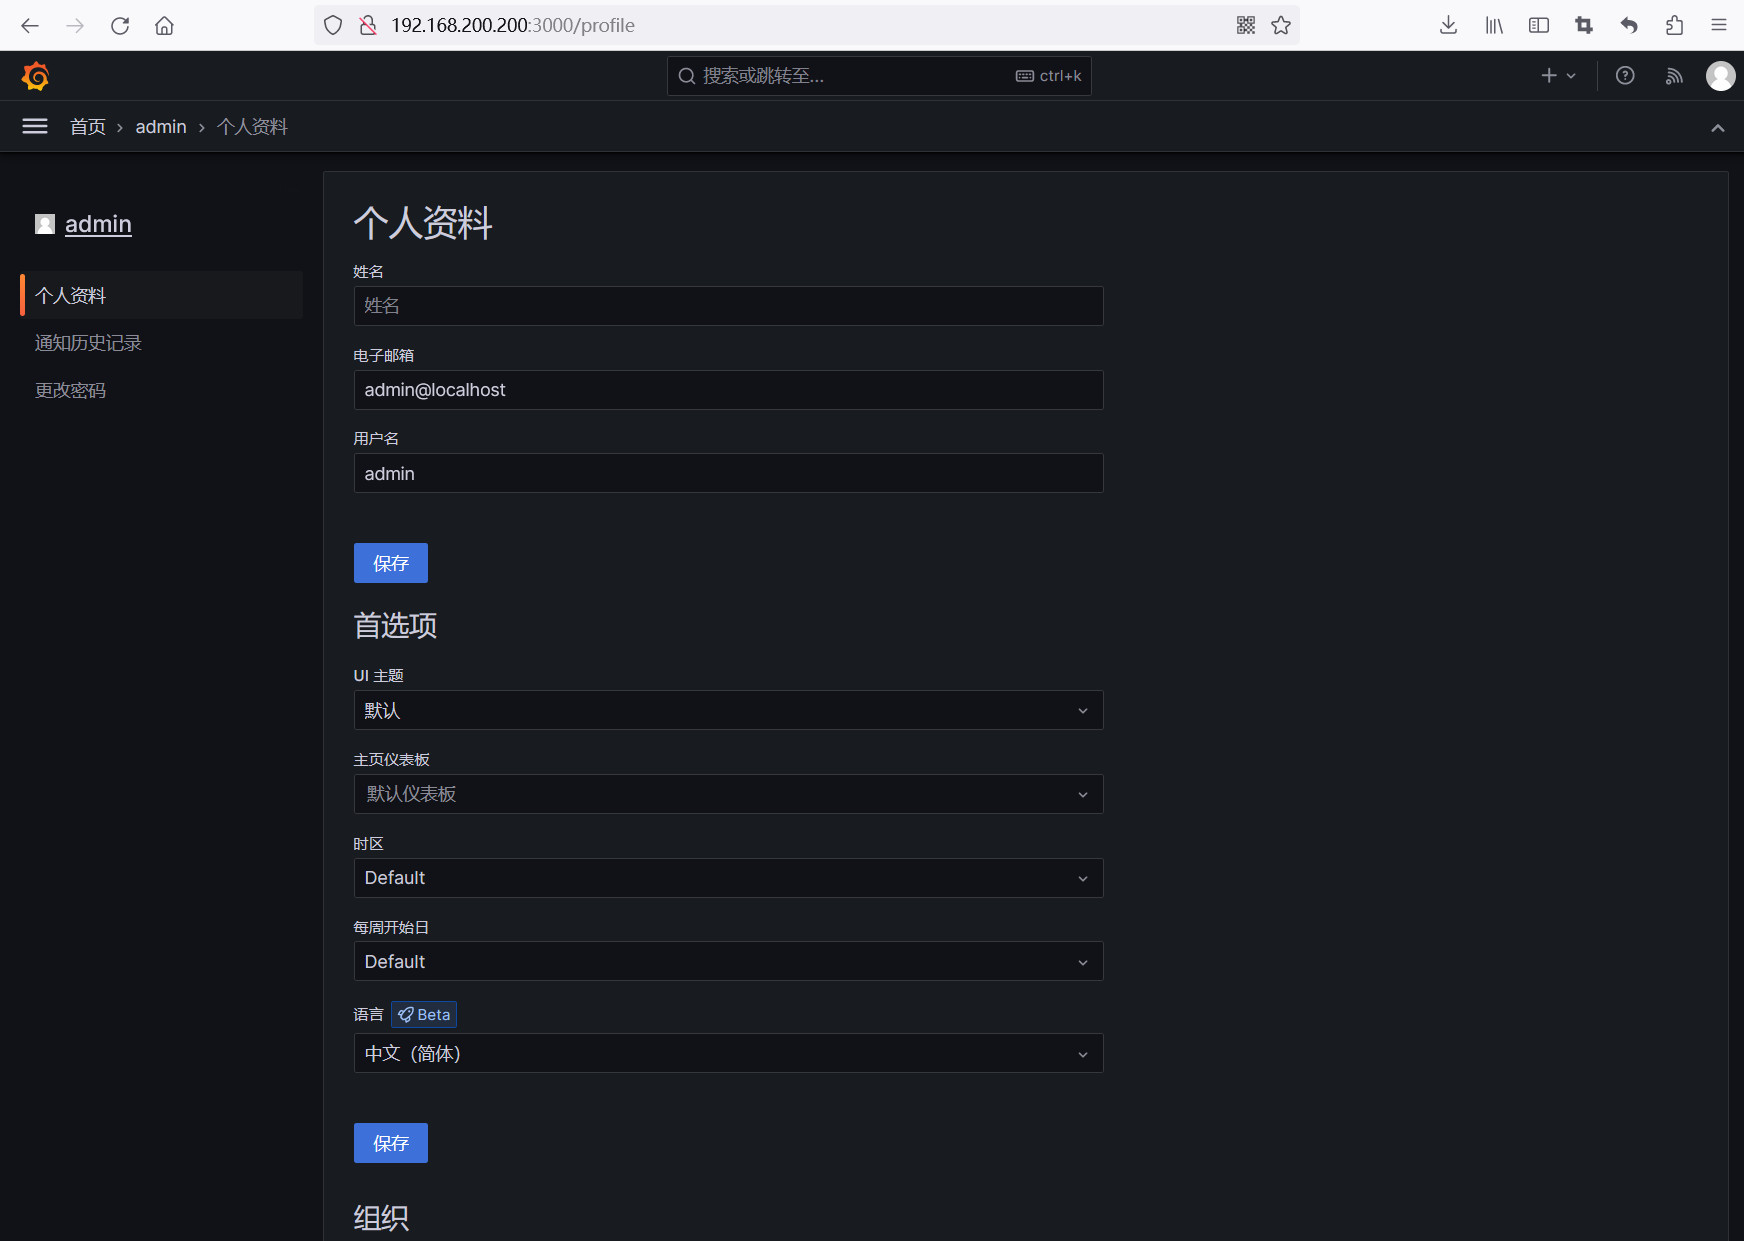
设置语言为中文
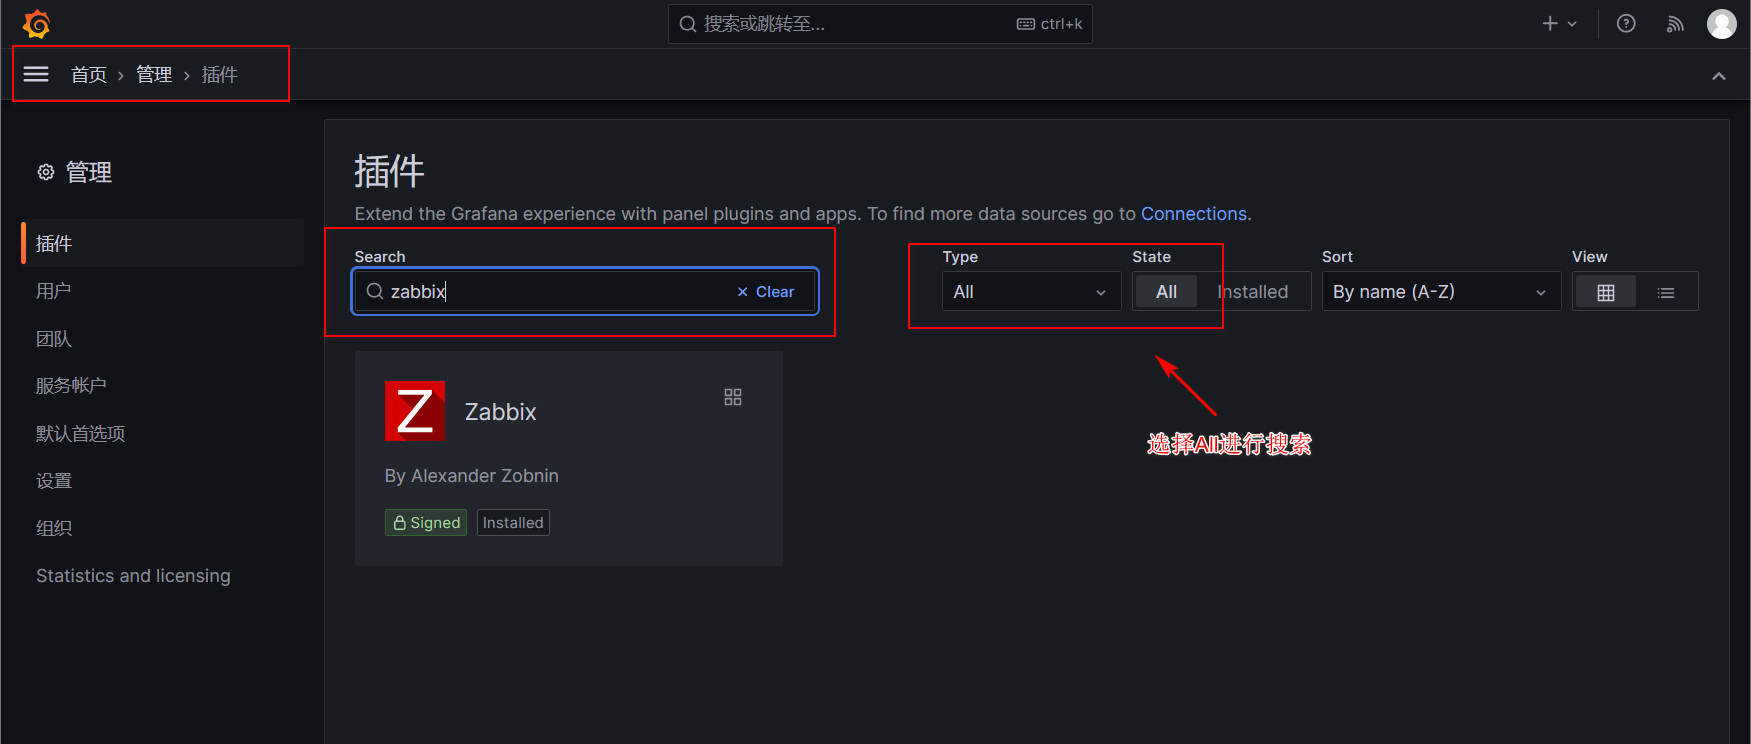
五、安装zabbix插件
web界面安装
在管理——插件 中搜索zabbix 之后选择安装(搜索时选择所有)
命令行安装插件
安装zabbix插件
grafana-cli plugins install alexanderzobnin-zabbix-app


列出可用插件
grafana-cli plugins list-remote


安装列出的插件
[root@zabbix-server /var/lib/grafana]# grafana-cli plugins ls
installed plugins:
alexanderzobnin-zabbix-app @ 4.4.1
之后重启服务
systemctl restart grafana-server.service
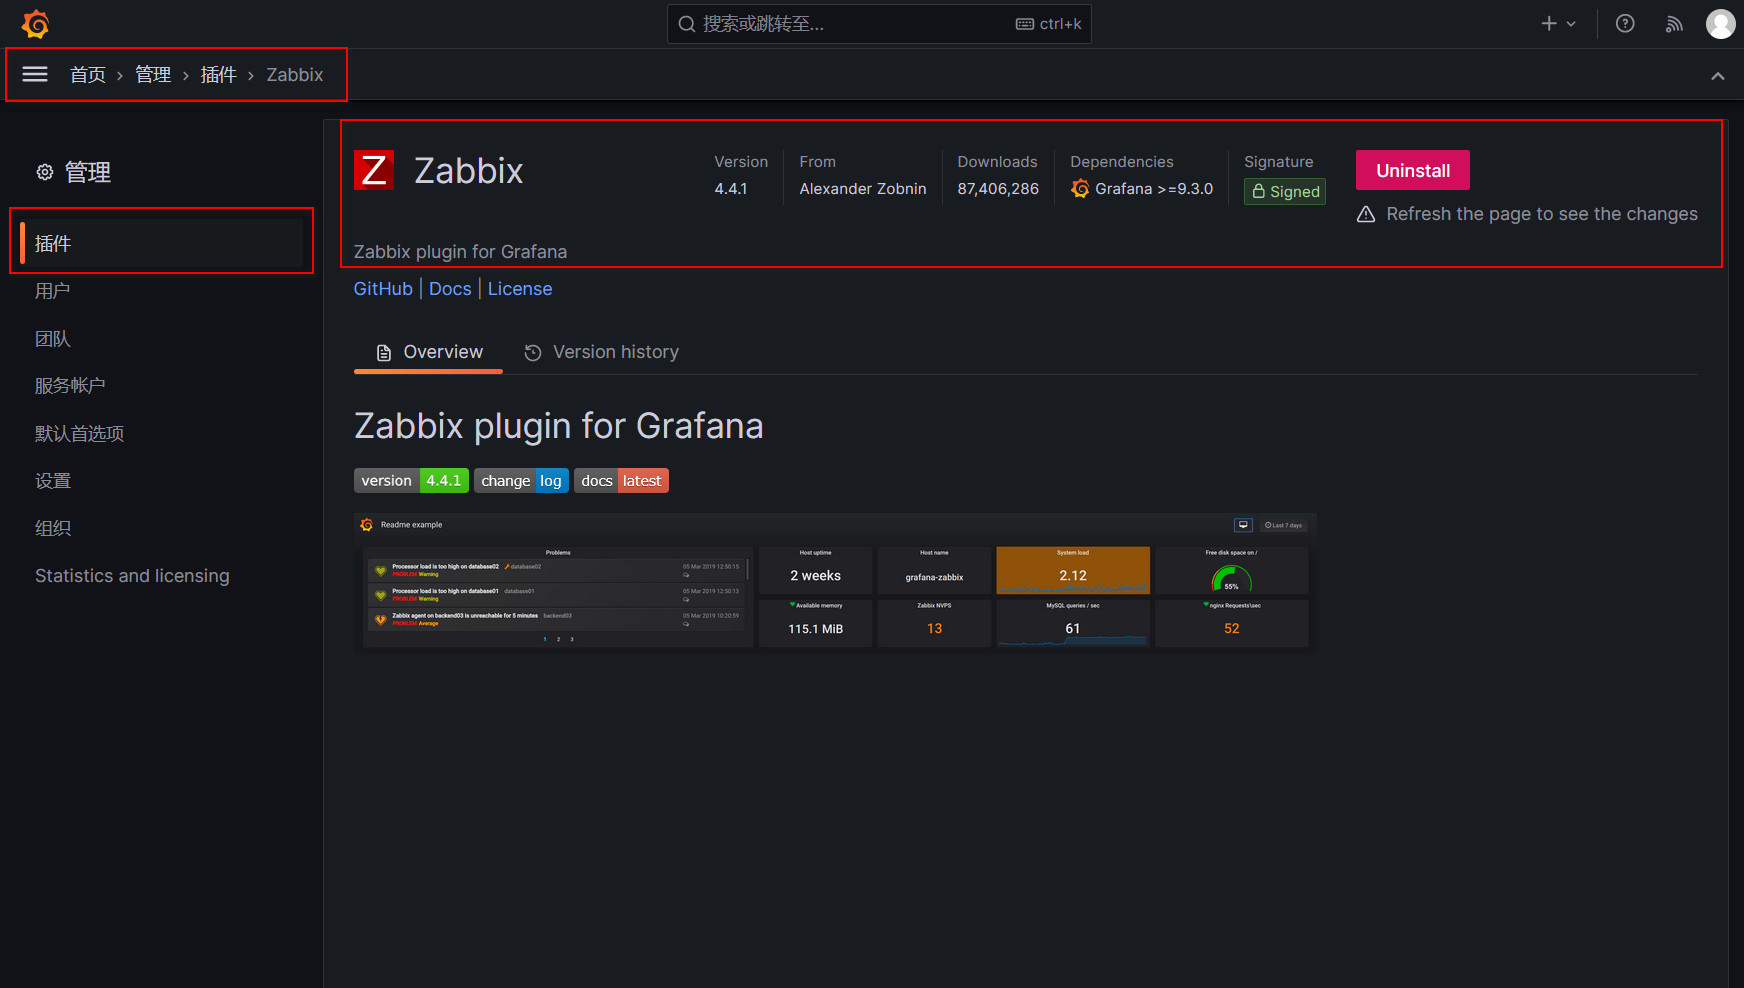
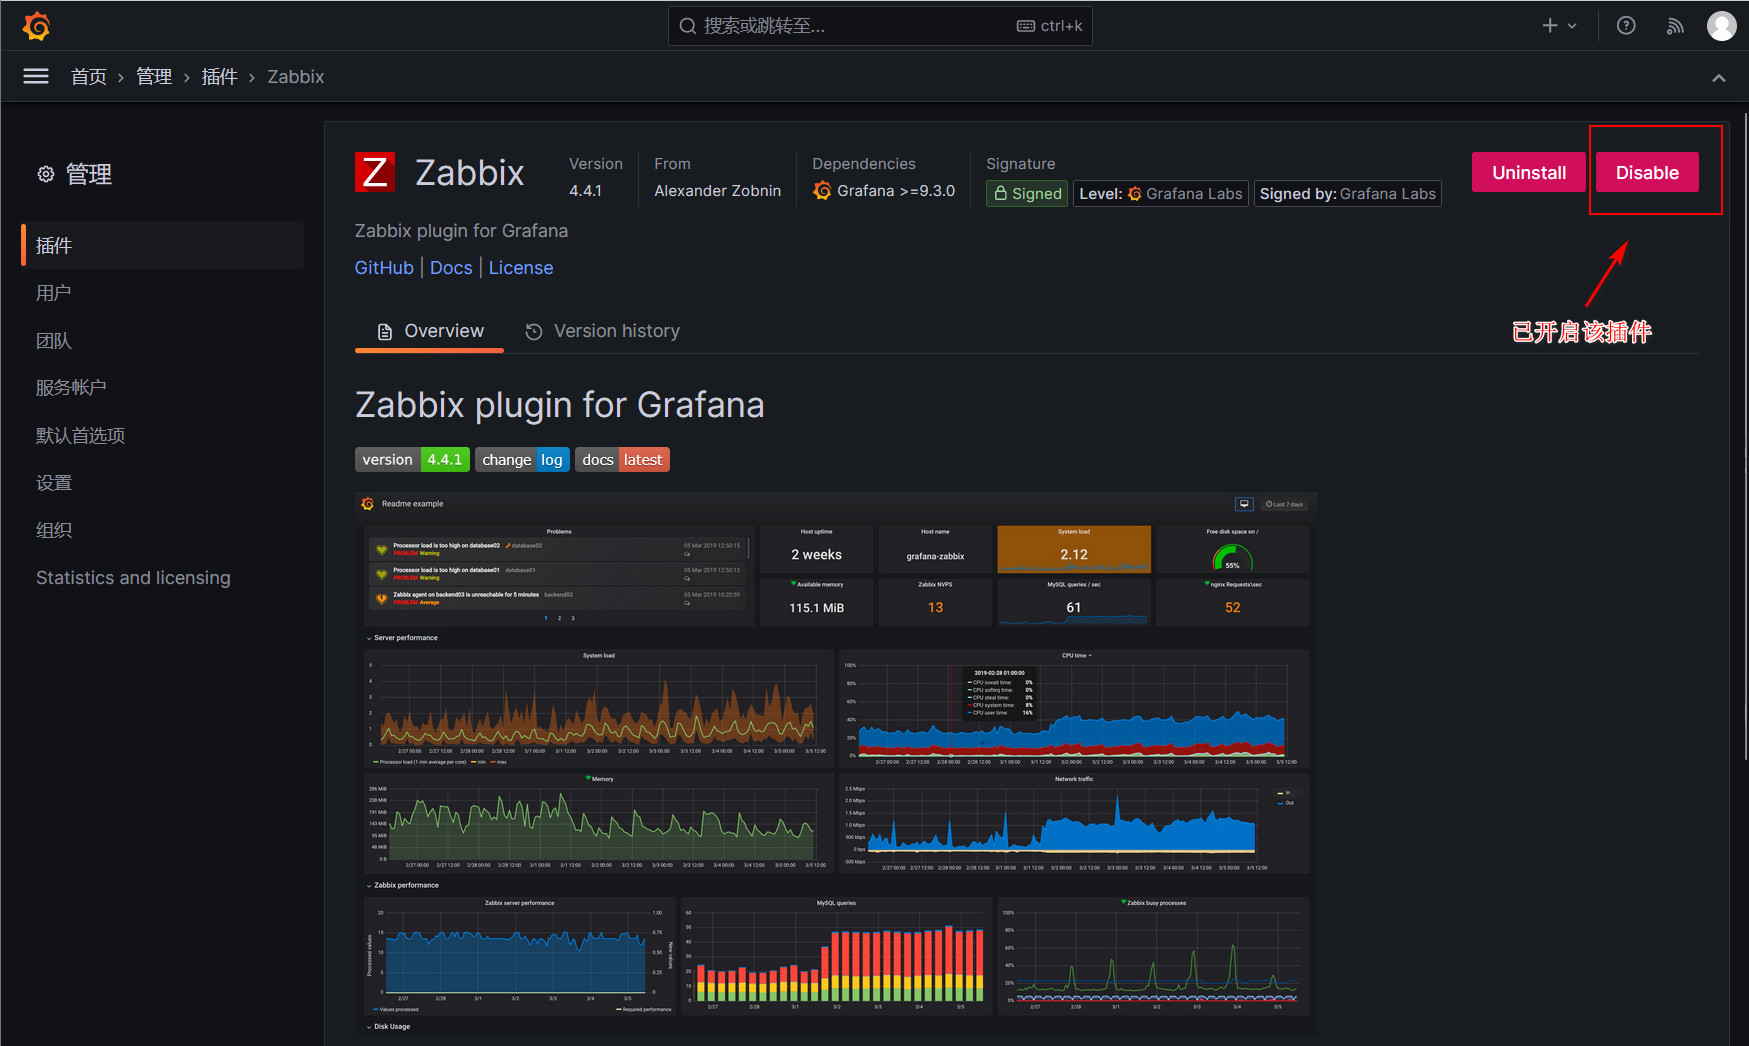
六、开启插件
重启服务后刷新页面右上角会出现Enable的按钮,点击即可开启

七、配置zabbix插件
在Connections中找到zabbix插件进行配置
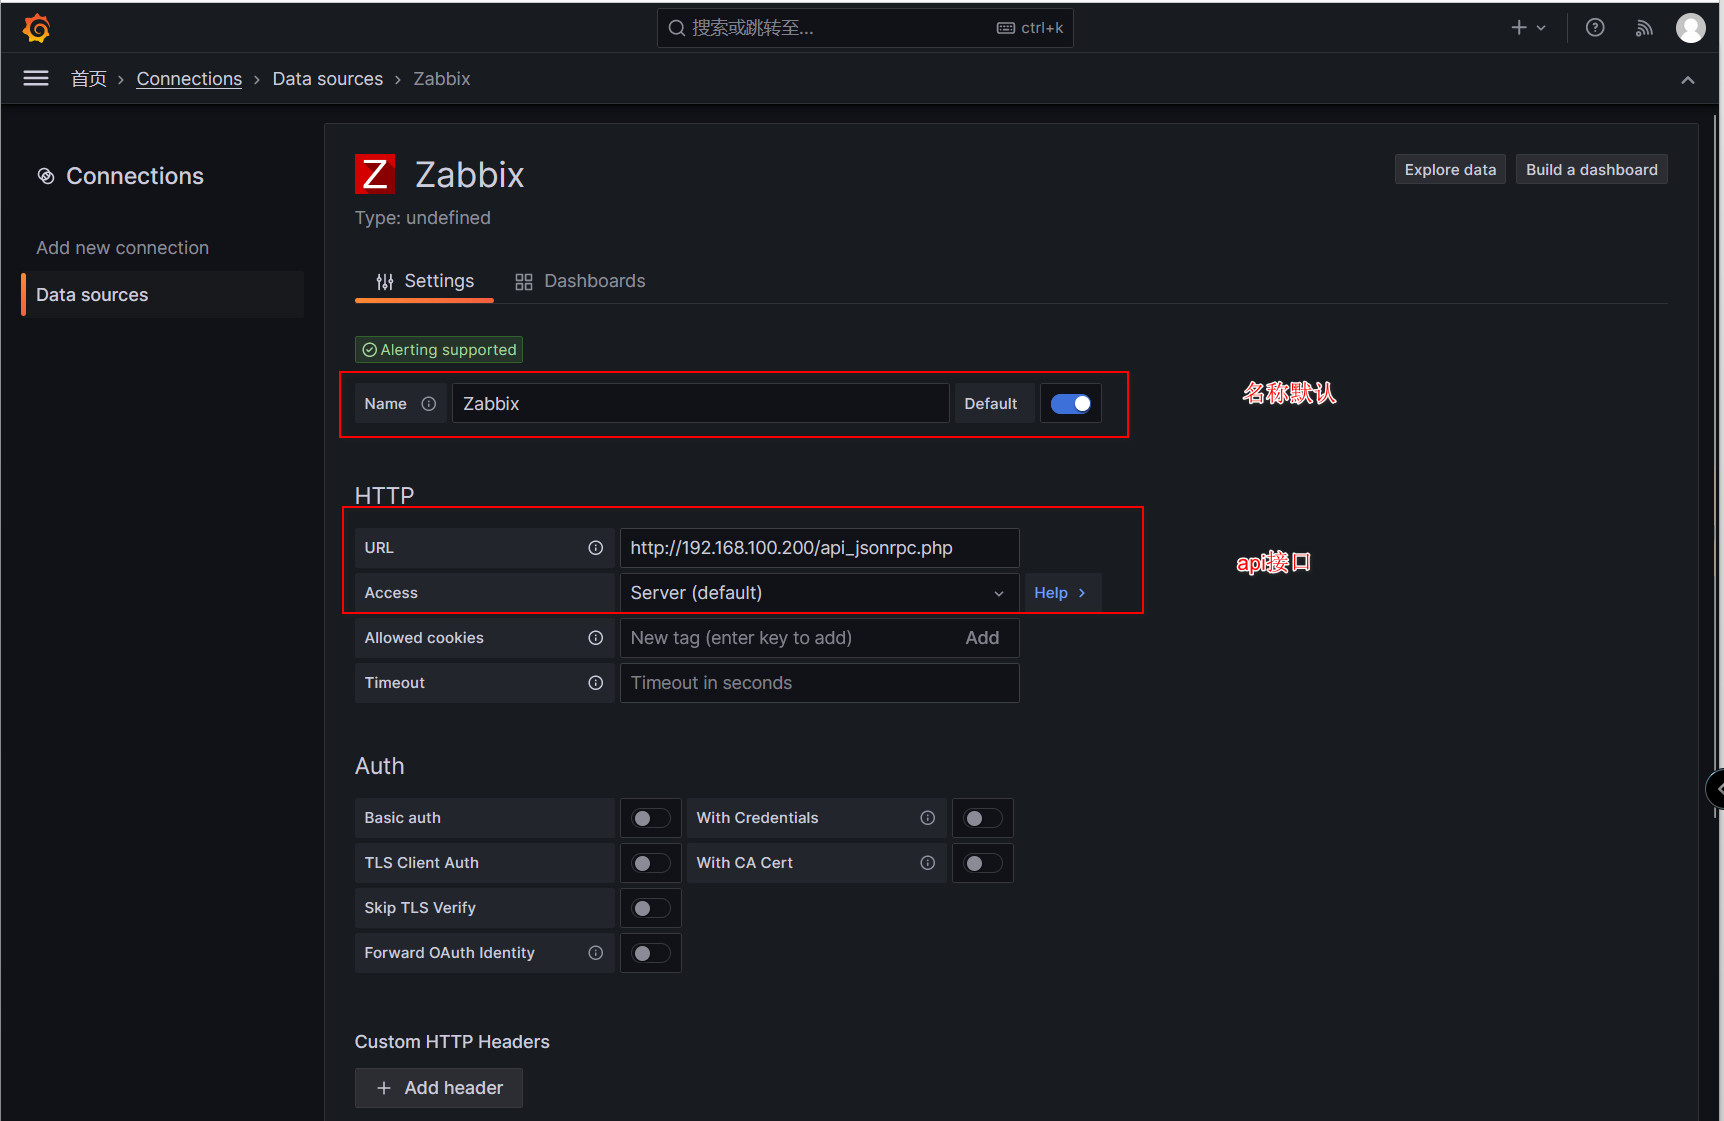

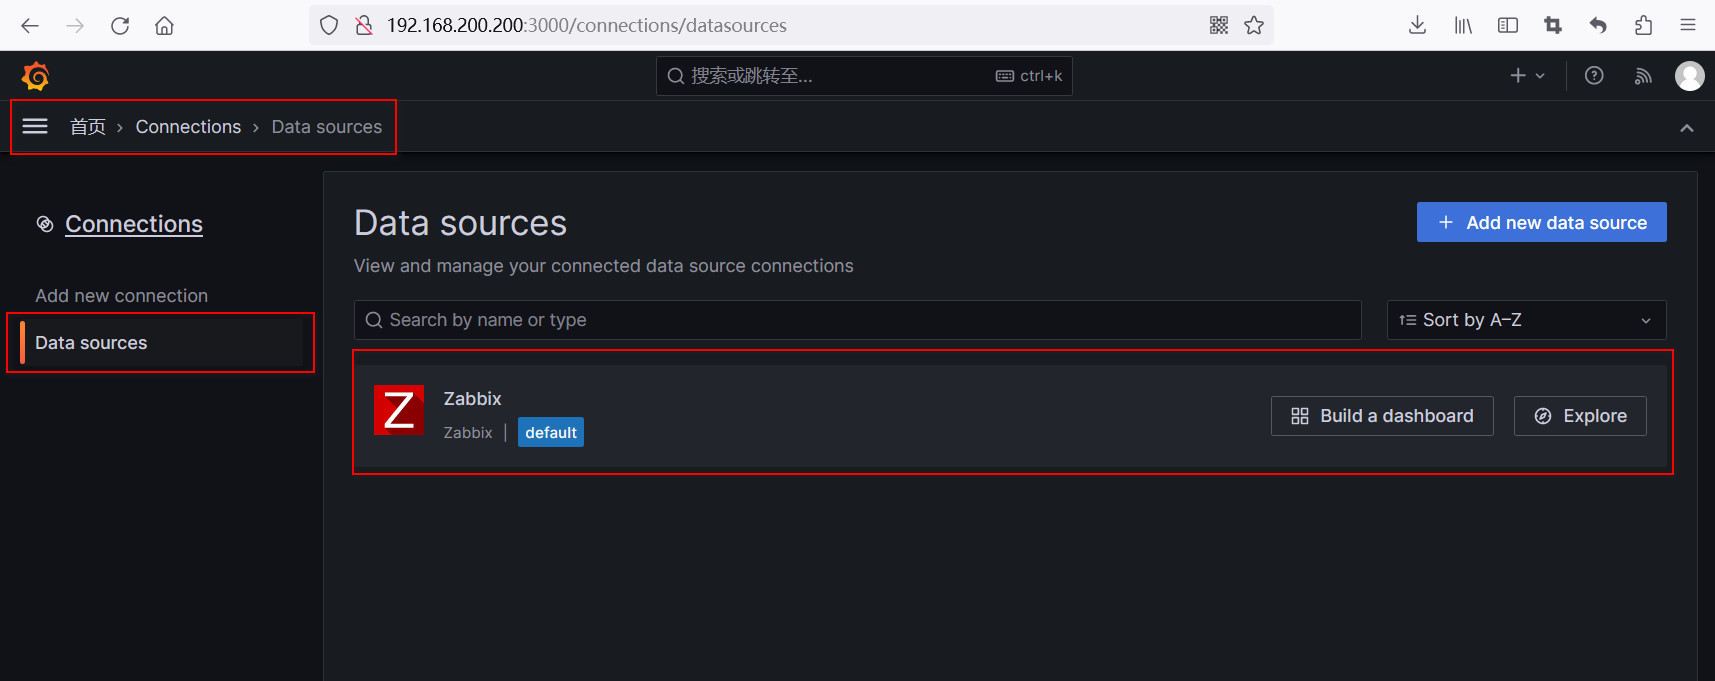
八、添加数据源
在connections——Data sources找到该zabbix插件进行配置
点击Build a dashboard
点击添加可视化

选择zabbix进行添加


添加完点击右上角的保存即可
最终效果:

九、Grafana配置https
9.1、生成自签名证书
在grafanf存放目录下创建ssl目录用于存放证书文件,主目录:/etc/grafana
mkdir /etc/grafana/ssl

cd /etc/grafana/ssl

创建CA
openssl req -newkey rsa:4096 -nodes -sha256 -keyout ca.key -x509 -days 365 -out ca.crt
Generating a RSA private key
...............................................................++++
.......................++++
writing new private key to 'ca.key'
-----
You are about to be asked to enter information that will be incorporated
into your certificate request.
What you are about to enter is what is called a Distinguished Name or a DN.
There are quite a few fields but you can leave some blank
For some fields there will be a default value,
If you enter '.', the field will be left blank.
-----
Country Name (2 letter code) [XX]:CN
State or Province Name (full name) []:wlmq
Locality Name (eg, city) [Default City]:wlmq
Organization Name (eg, company) [Default Company Ltd]:wlmq
Organizational Unit Name (eg, section) []:wlmq
Common Name (eg, your name or your server's hostname) []:wlmq.com
Email Address []:wlmq@test.com

生成证书签名请求
openssl req -newkey rsa:4096 -nodes -sha256 -keyout wlmq.com.key -out wlmq.com.csr
Generating a RSA private key
....................................++++
............................................................................................................................................................................................................................................................................................................................................................++++
writing new private key to 'wlmq.com.key'
-----
You are about to be asked to enter information that will be incorporated
into your certificate request.
What you are about to enter is what is called a Distinguished Name or a DN.
There are quite a few fields but you can leave some blank
For some fields there will be a default value,
If you enter '.', the field will be left blank.
-----
Country Name (2 letter code) [XX]:CN
State or Province Name (full name) []:wlmq
Locality Name (eg, city) [Default City]:wlmq
Organization Name (eg, company) [Default Company Ltd]:wlmq
Organizational Unit Name (eg, section) []:wlmq
Common Name (eg, your name or your server's hostname) []:wlmq.com
Email Address []:wlmq@test.com

Please enter the following 'extra' attributes
to be sent with your certificate request
A challenge password []:wlmq
An optional company name []:wlmq

生成注册表主机的证书
openssl x509 -req -days 365 -in wlmq.com.csr -CA ca.crt -CAkey ca.key -CAcreateserial -out wlmq.com.crt
Signature ok
subject=C = CN, ST = wlmq, L = wlmq, O = wlmq, OU = wlmq, CN = wlmq.com, emailAddress = wlmq@test.com
Getting CA Private Key

查看证书生成情况
ll
总用量 104
-rw-r--r-- 1 root root     2082 10月  1 04:10 ca.crt
-rw------- 1 root root     3272 10月  1 04:09 ca.key
-rw-r--r-- 1 root root       41 10月  1 04:13 ca.srl
-rw-r--r-- 1 root root     1960 10月  1 04:13 wlmq.com.crt
-rw-r--r-- 1 root root     1781 10月  1 04:12 wlmq.com.csr
-rw------- 1 root root     3272 10月  1 04:11 wlmq.com.key

rm -fr ca.*

信任自签发证书
由于CA证书是我们自己签发的,系统本身是不信任的,因此我们需要吧证书导入到我们系统的信任证书里
cp wlmq.com.crt /etc/pki/ca-trust/source/anchors/

update-ca-trust extract

update-ca-trust enable
9.2、Grafana配置https使用自签名证书
在grafana配置文件里,指定证书存放位置及名称
vim /etc/grafana/grafana.ini

[server]
protocol = https                                                #开启https
http_addr =   # 监听的ip地址,,默认是0.0.0.0
http_port = 3000  # 监听的端口,默认是3000
domain = localhost  # 这个设置是root_url的一部分,当你通过浏览器访问grafana时的公开的domian名称,默认是localhost
enforce_domain = false  # 如果主机的header不匹配domian,则跳转到一个正确的domain上,默认是false
root_url = https://localhost:3000  # 这是一个web上访问grafana的全路径url,默认是%(protocol)s://%(domain)s:%(http_port)s/
router_logging = false  # 是否记录web请求日志,默认是false
static_root_path = public  # 前端文件(HTML,JS和CSS文件)的目录路径。 默认为public
enable_gzip = false
cert_file = /etc/grafana/ssl/wlmq.com.crt              #指定证书文件
cert_key = /etc/grafana/ssl/wlmq.com.key               #指定证书私钥

重启服务
systemctl restart grafana-server

如果重启服务失败,则需要把wlmq.com.key的文件权限更改为755
chmod 755 wlmq.com.key
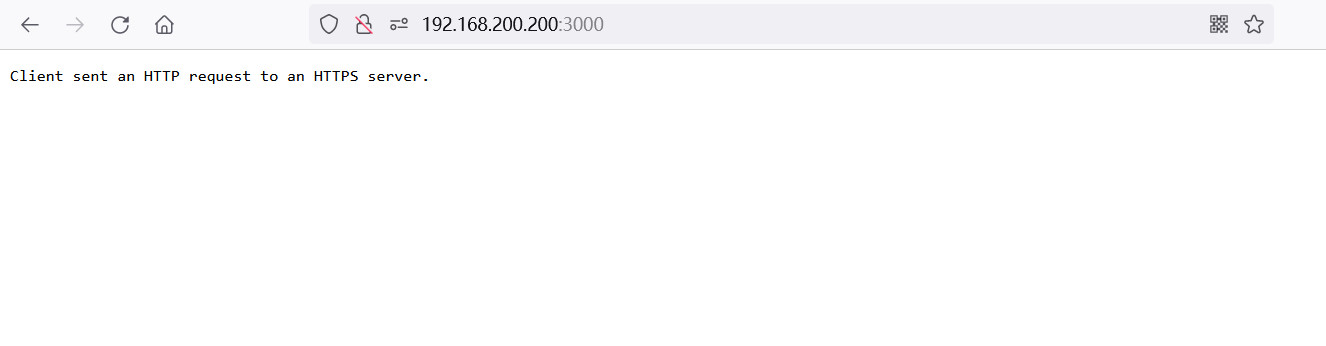
9.3、测试访问
通过http访问会提示 Client sent an HTTP request to an HTTPS server.
通过https访问正常
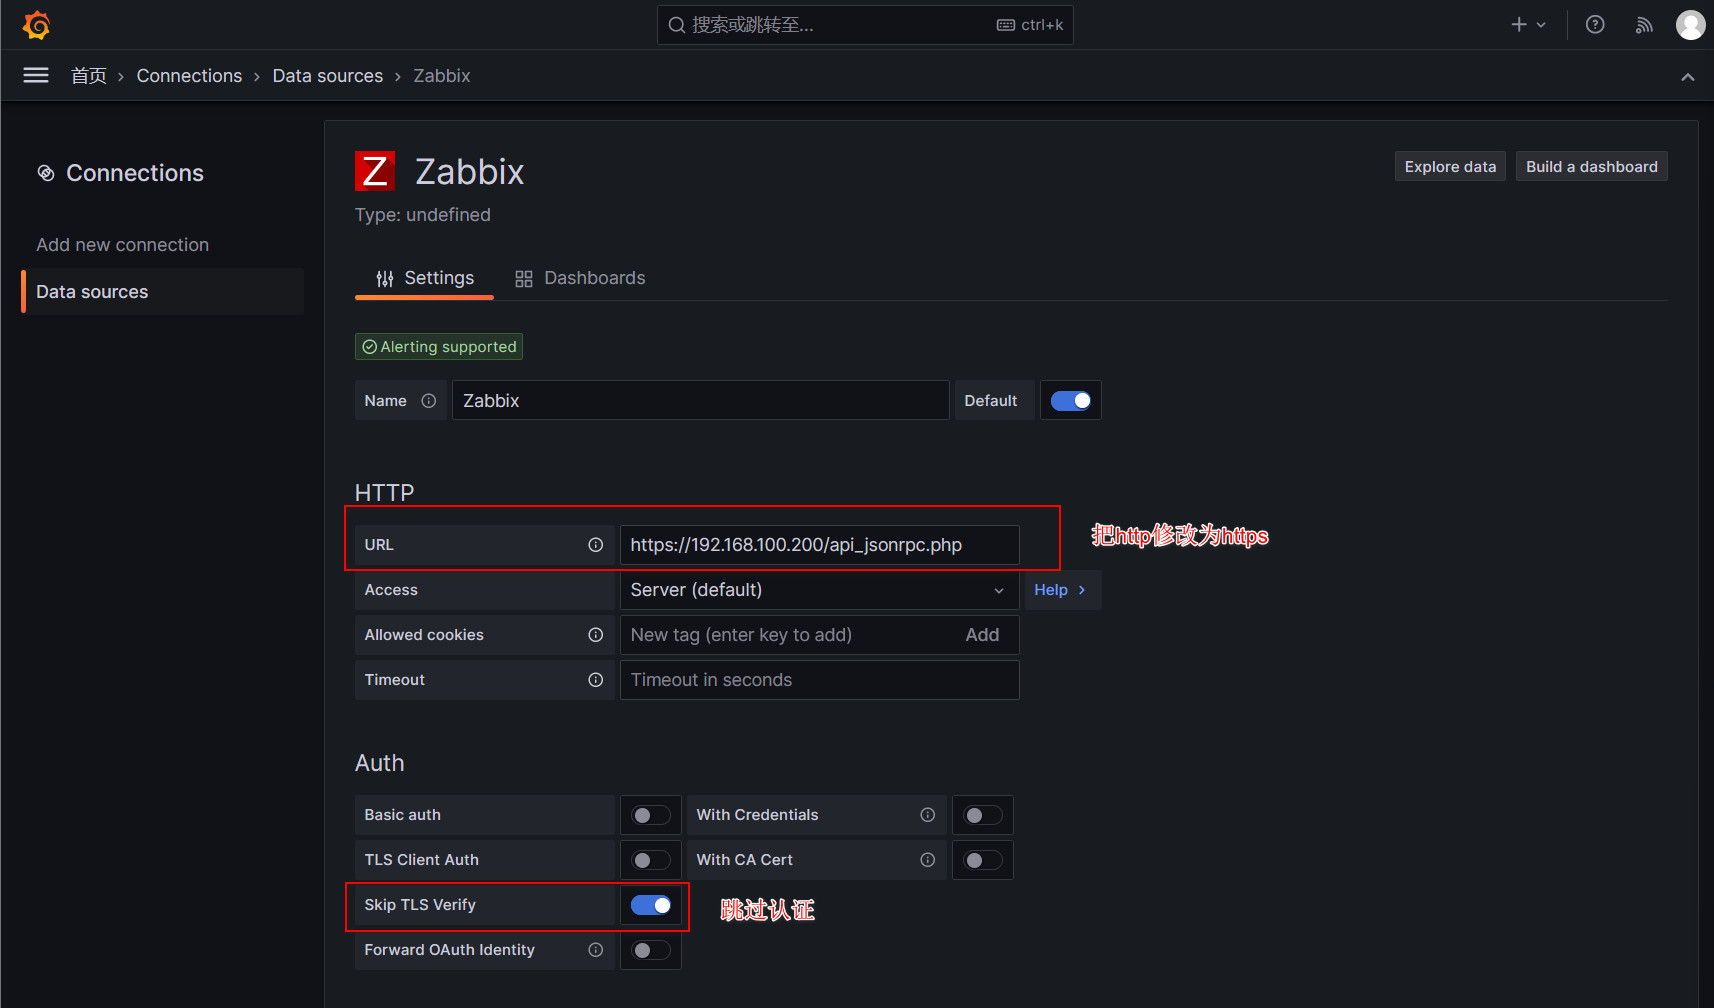
9.4、更改zabbix插件api接口为https
说明:由于zabbix和grafana都开启了https访问,grafana中的zabbix插件配置的http api 接口需要修改为https
十、使用grafana官网自带图表
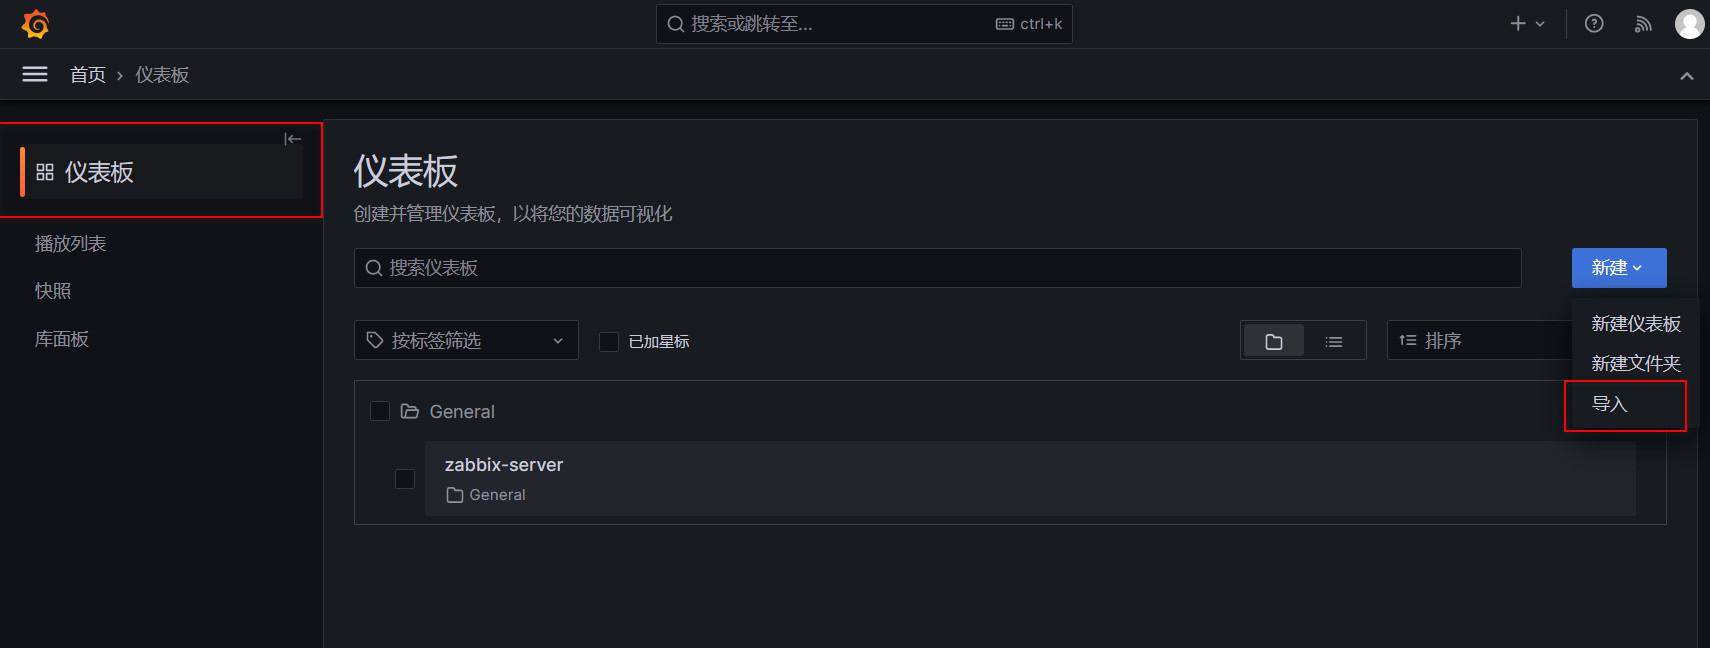
首页——仪表盘——新建——导入
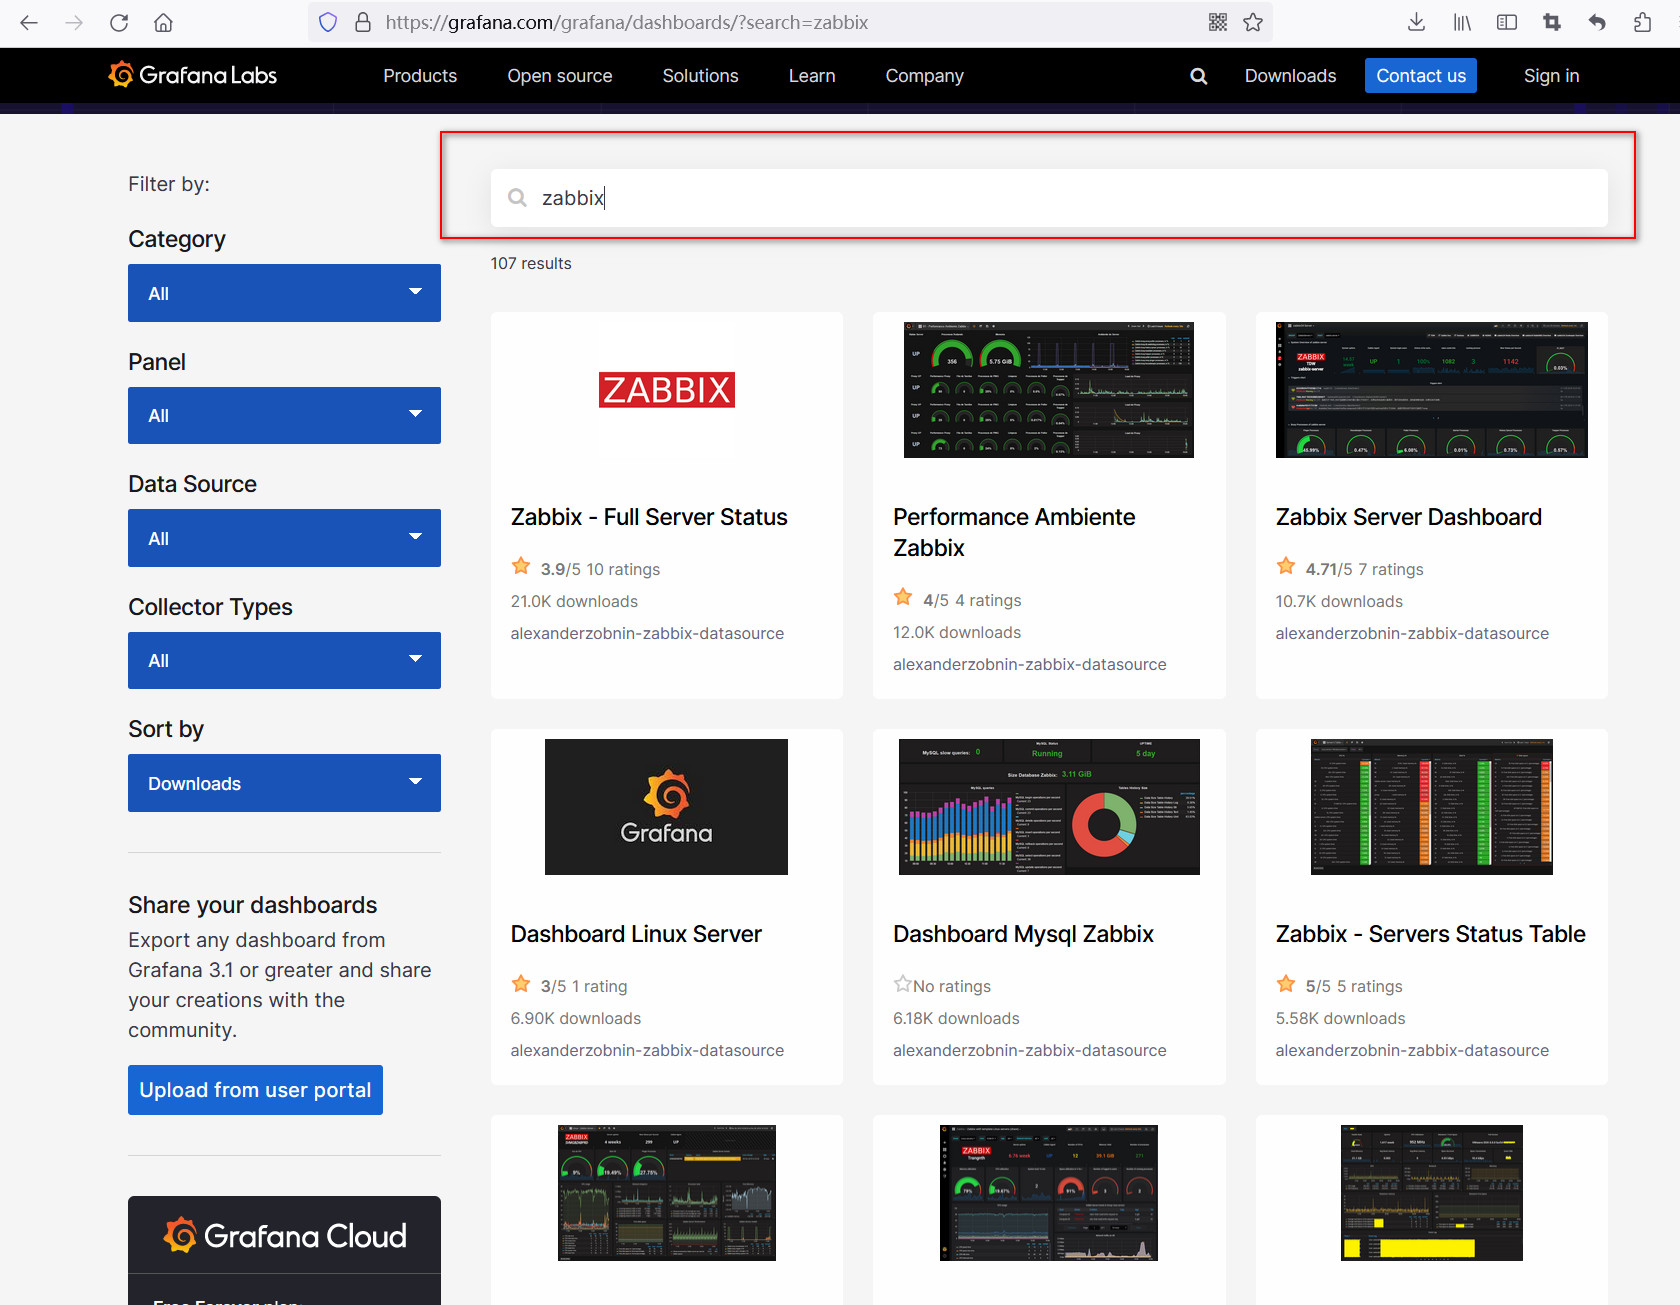
打开grafana官网图标链接
https://grafana.com/grafana/dashboards/
搜索zabbix
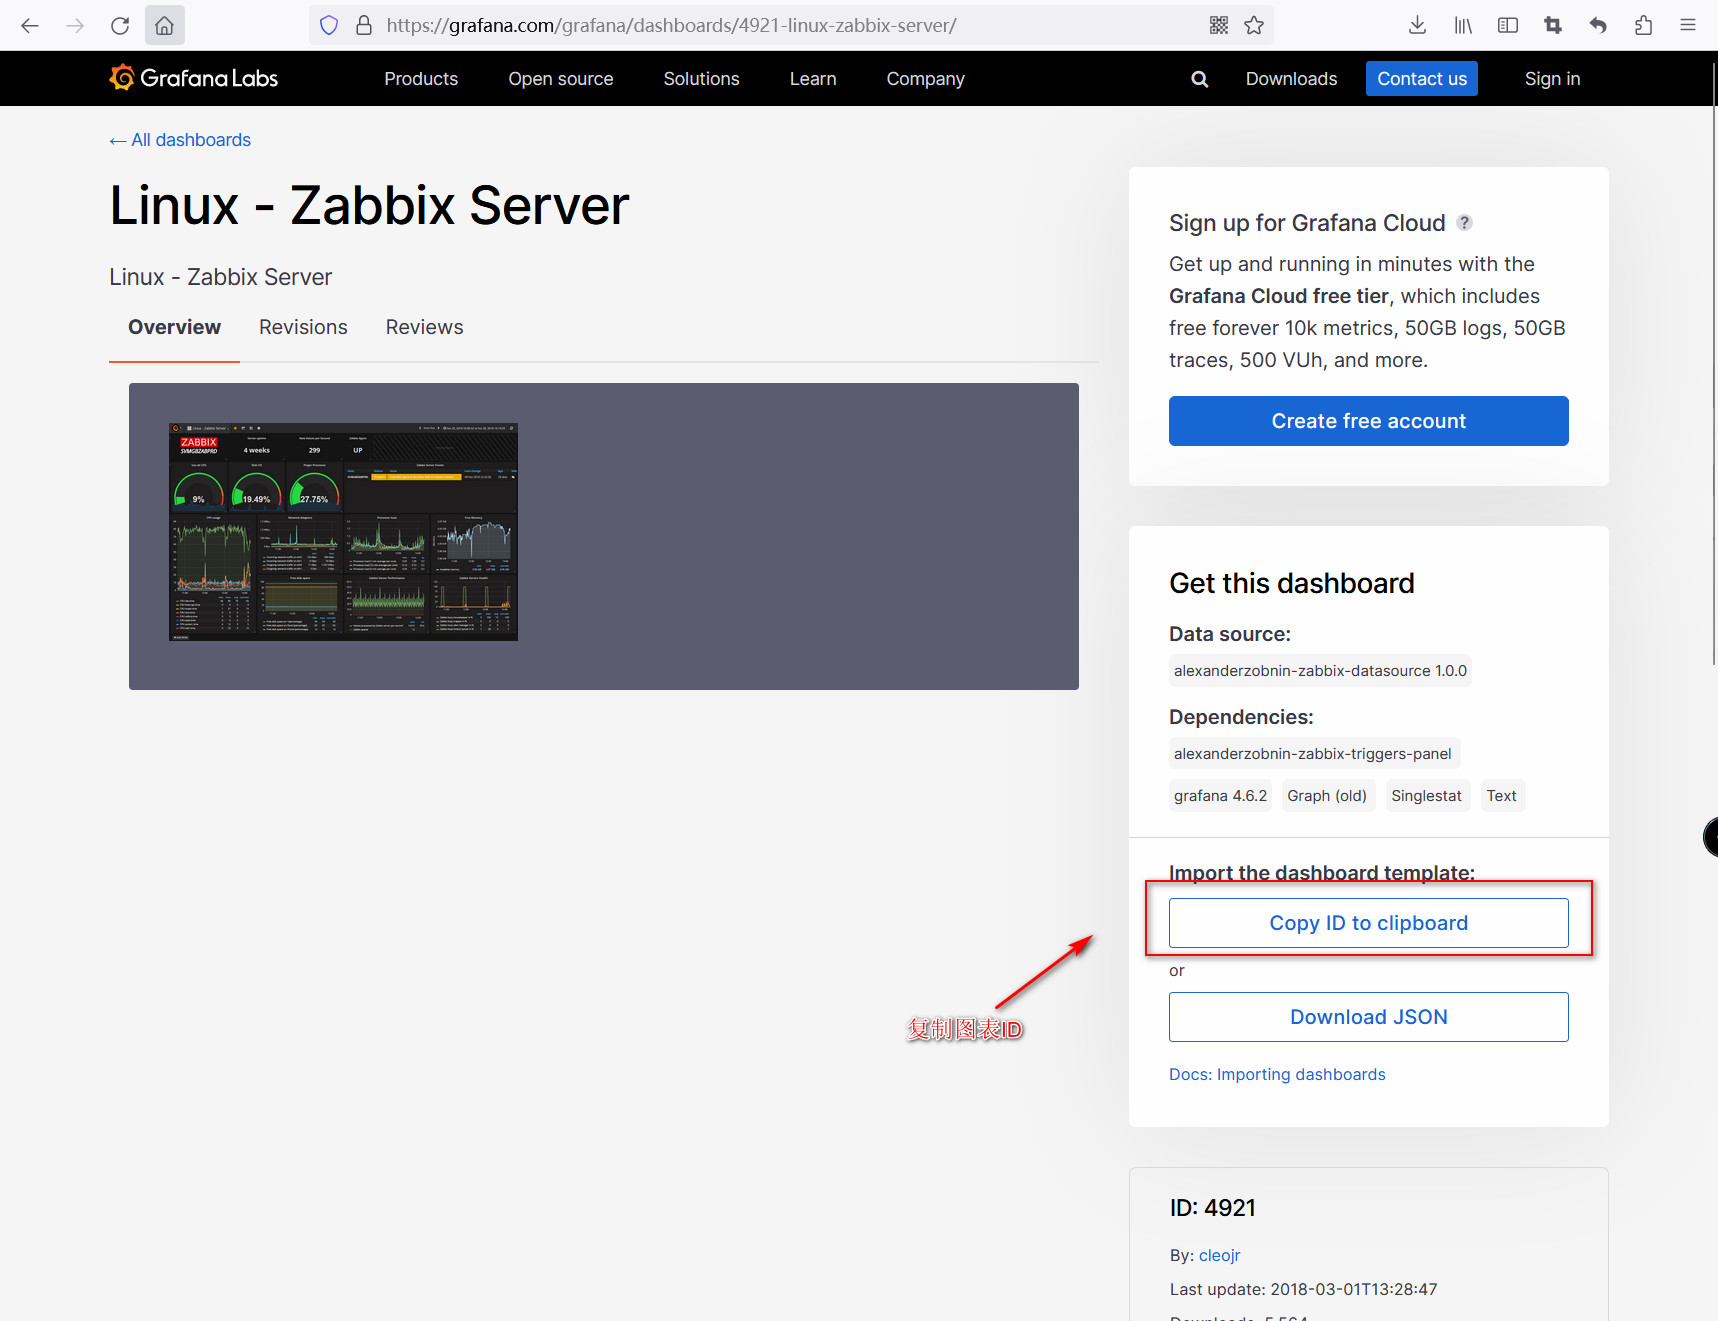
选择需要导入的图表,点进去复制图表ID
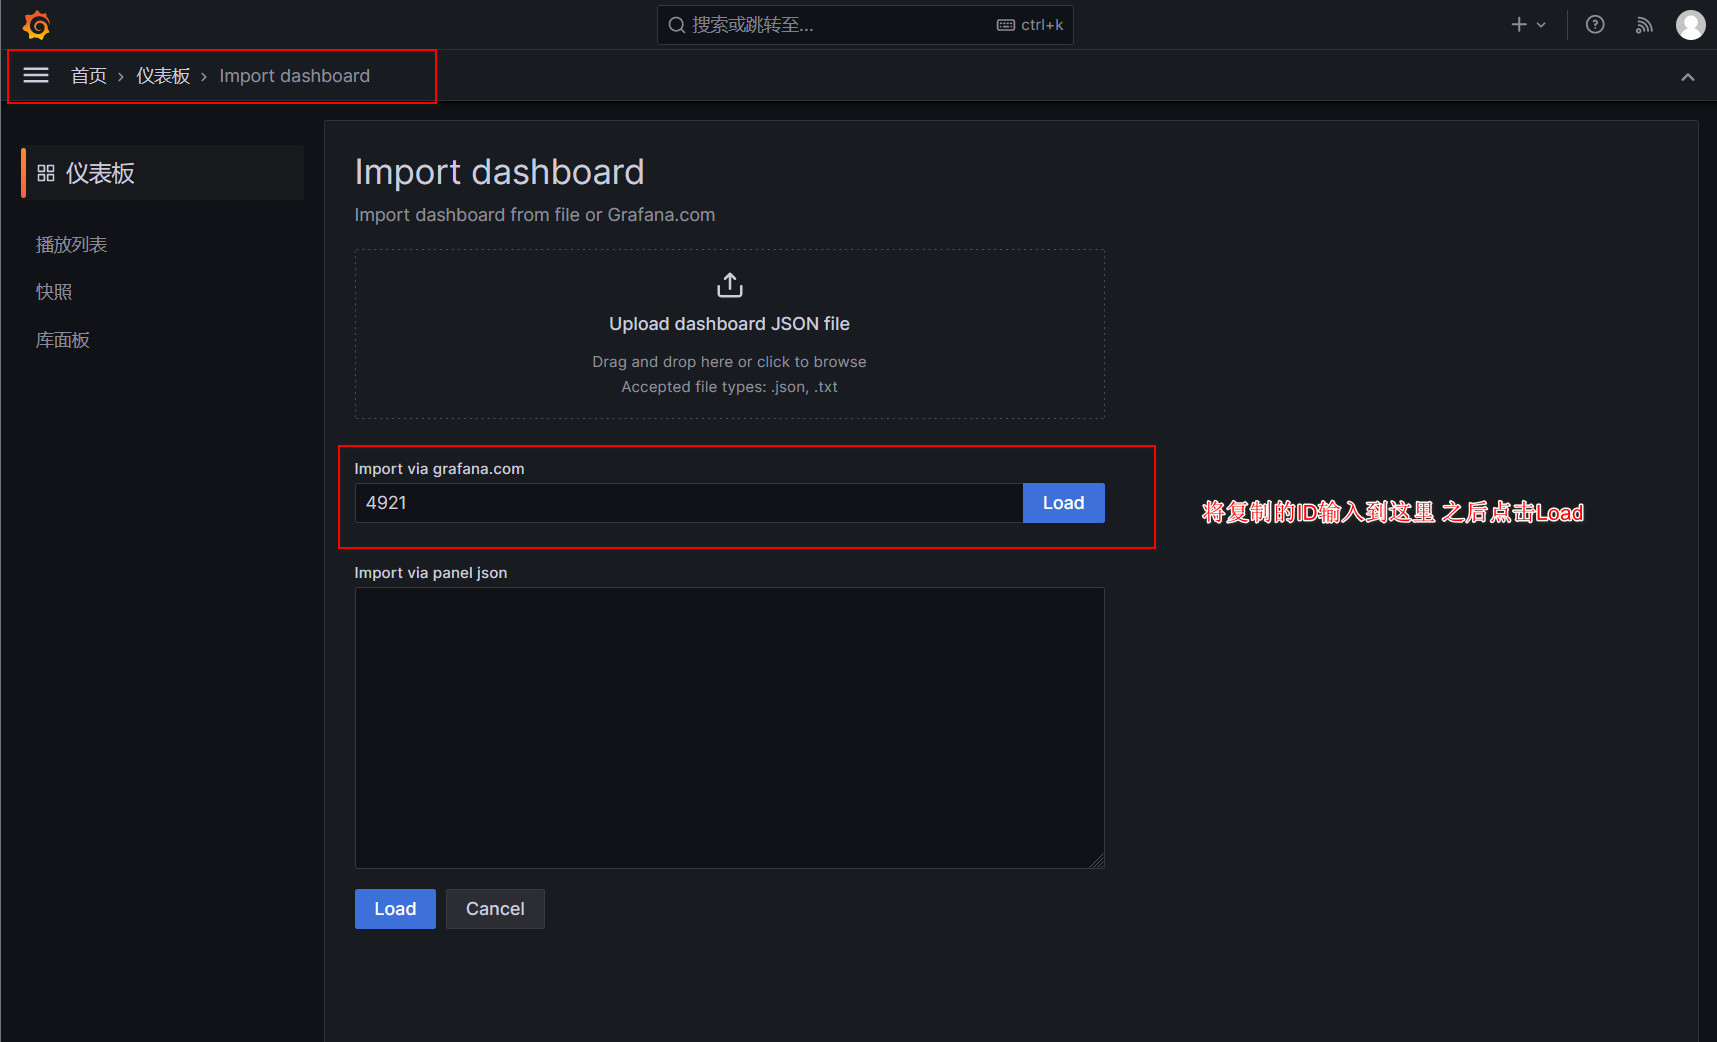
回到grafana Import dashboard界面输入复制的ID,之后点击Load
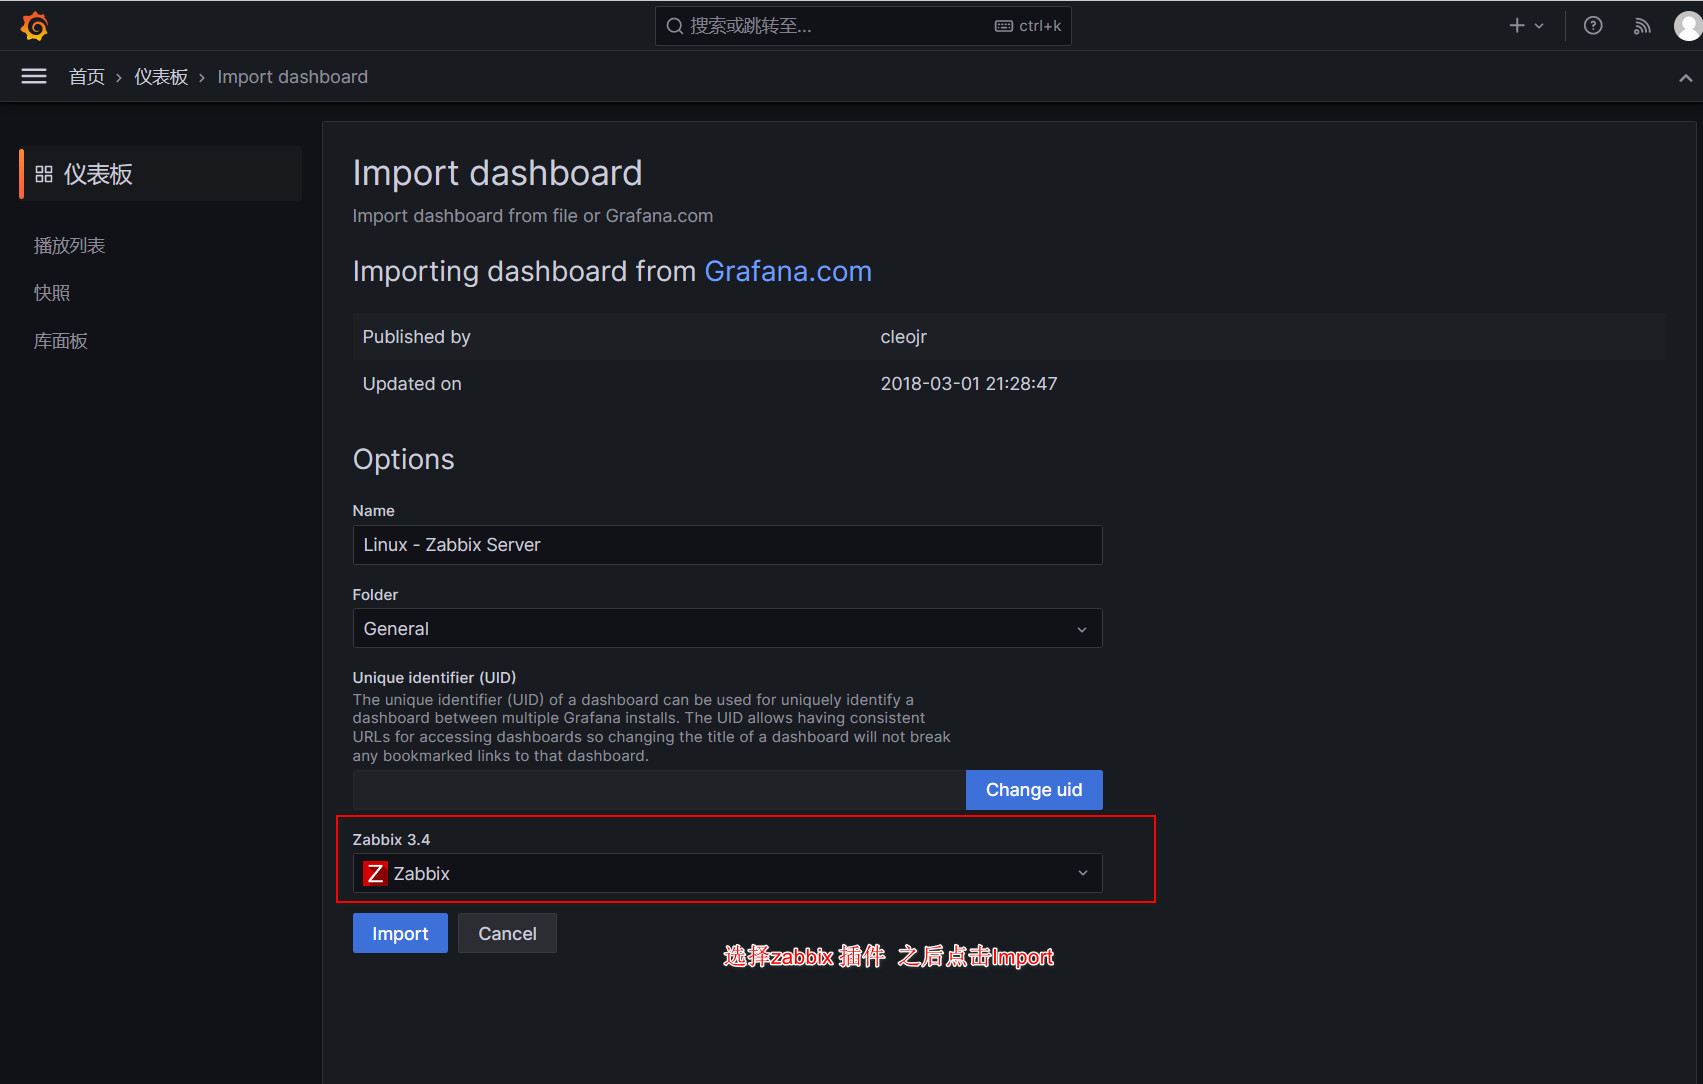
导入成功后如下所示
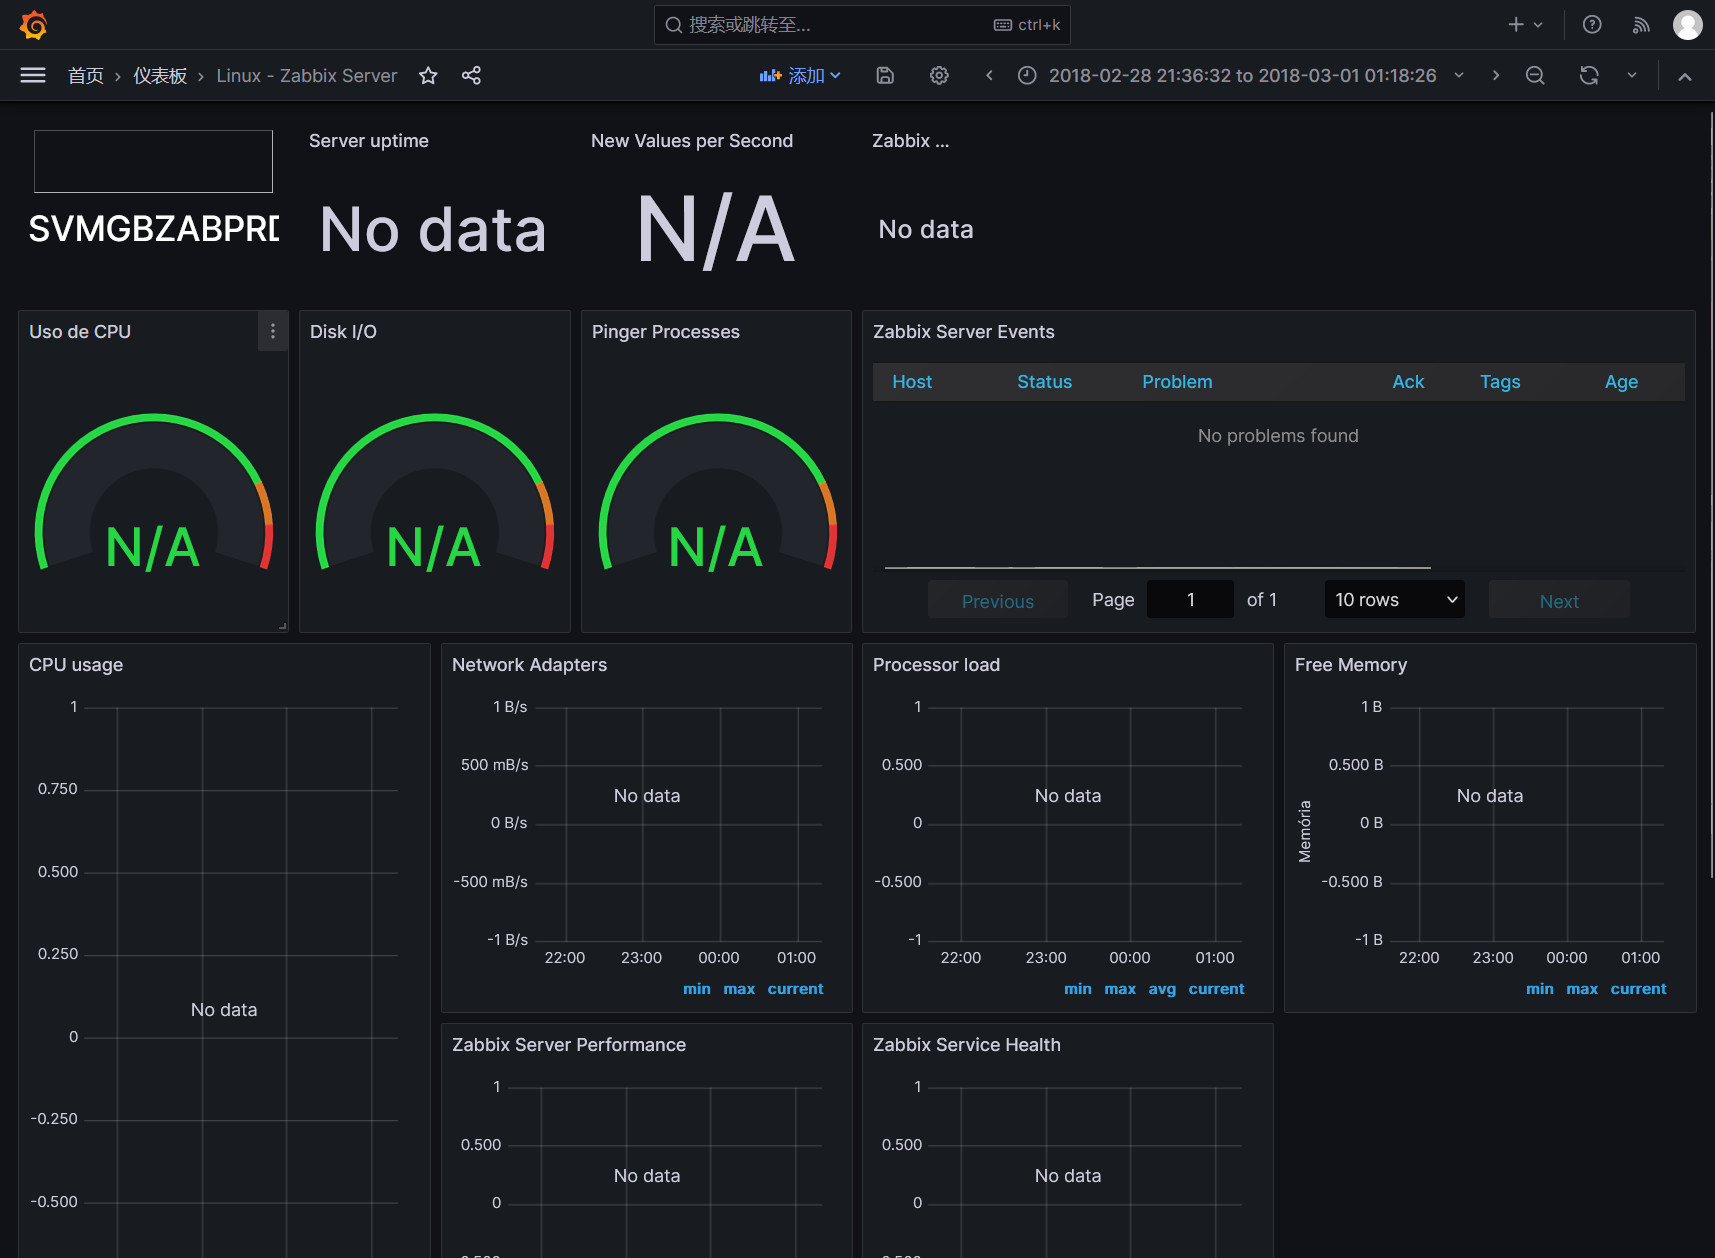
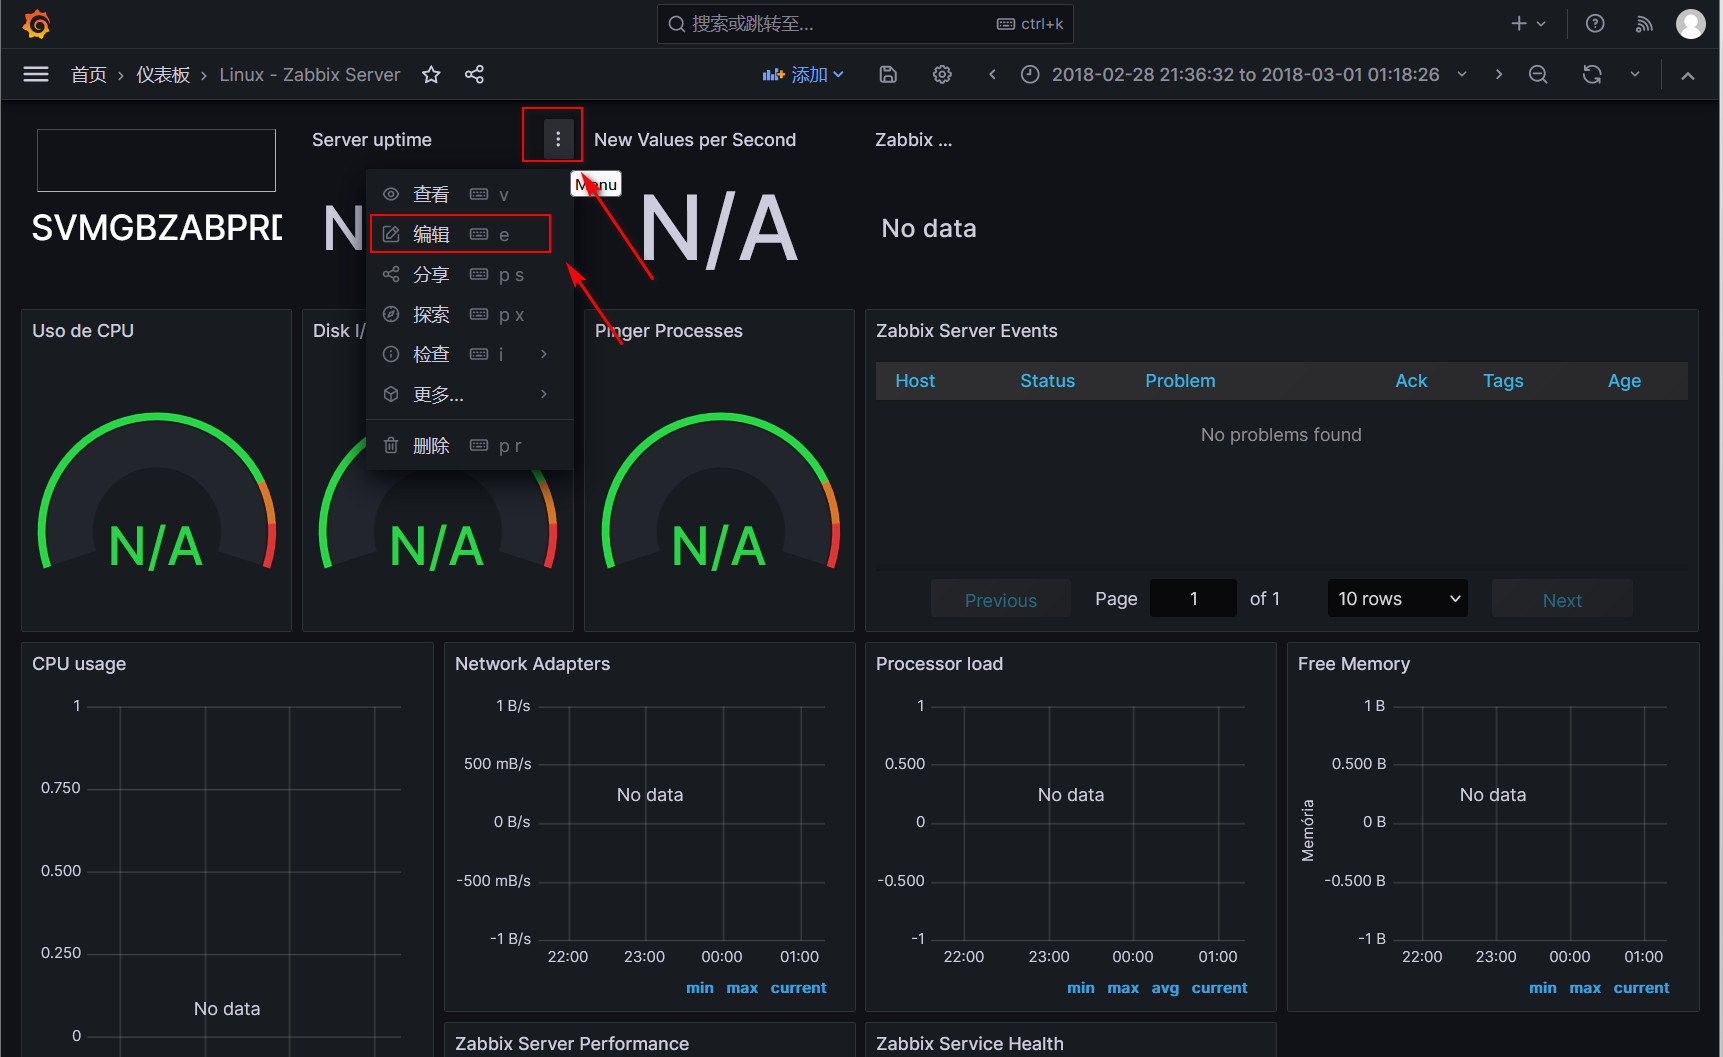
如果导入的图表获取不到数据 可以对图表进行编辑
******************************我也想难过的时候到海边走走,可是我的城市没有海。******************************

 浙公网安备 33010602011771号