SMOOTHING (LOWPASS) SPATIAL FILTERS
Gonzalez R. C. and Woods R. E. Digital Image Processing (Forth Edition).
import cv2
import matplotlib.pyplot as plt
import numpy as np
FILTERS
filters实际上就是通过一些特殊的kernel \(w\) 对图片进行如下操作:
\[g(x, y) = \sum_{s=-a}^a \sum_{t=-b}^b w(s, t) f(x+s, y+t), \: x = 1,2,\cdots, M, \: y = 1, 2,\cdots N.
\]
其中\(w(s, t) \in \mathbb{R}^{m \times n}, m=2a+1, n = 2b+1\).
注: 注意到上面会出现\(f(-1, -1)\)之类的未定义情况, 常见的处理方式是在图片周围加padding(分别为pad a, b), 比如补0或者镜像补.
用卷积的目的是其特别的性质:
- \(f * g = g * f\);
- \(f * (g * h) = (f * g) * h\);
- \(f * (g + h) = (f * g) + (g * h)\).
注: \(f, g, h\)应当形状一致 (或者每次卷积完同样进行padding).
特别的, 如果
\[w = uv^T,
\]
则
\[w * f = u * (v^T * f).
\]
可以显著降低计算量.
Box Filter Kernels
即
\[w_{ij} = \frac{1}{mn}, \quad i=1,2,\cdots, m, \: j=1,2,\cdots, n.
\]
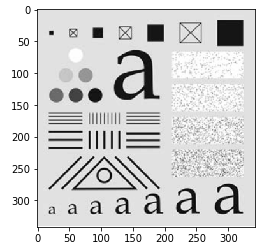
img = cv2.imread("./pics/alphabeta.png")
img.shape
img = cv2.cvtColor(img, cv2.COLOR_BGR2GRAY) # 由于是截图, 先转成灰度图
plt.imshow(img, cmap='gray')
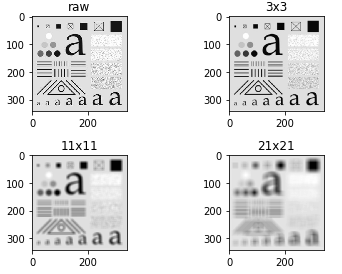
# 或者等价地用 cv2.blur(img, (m, n))
kernels = [np.ones((i, i)) / (i * i) for i in [3, 11, 21]]
imgs_smoothed = [cv2.filter2D(img, -1, kernel) for kernel in kernels]
fig, axes = plt.subplots(2, 2)
axes[0, 0].imshow(img, cmap='gray')
axes[0, 0].set_title("raw")
axes[0, 1].imshow(imgs_smoothed[0], cmap="gray")
axes[0, 1].set_title("3x3")
axes[1, 0].imshow(imgs_smoothed[1], cmap="gray")
axes[1, 0].set_title("11x11")
axes[1, 1].imshow(imgs_smoothed[2], cmap="gray")
axes[1, 1].set_title("21x21")
plt.tight_layout()
plt.show()
Lowpass Gaussian Filter Kernels
即
\[w(s, t) = G(s, t) = K e^{-\frac{s^2+t^2}{2\sigma^2}},
\]
高斯分布的特点是绝大部分集中于\((-3\sigma, +3\sigma)\)之间, 故一般\(w\)的大小选择为\((-6\sigma, +6\sigma)\), 需要注意的是, \(\sigma\)的选择和图片的大小息息相关.
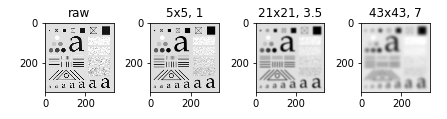
imgs_smoothed = [cv2.GaussianBlur(img, ksize=ksize, sigmaX=sigma) for (ksize, sigma) in [((5, 5), 1), ((21, 21), 3.5), ((43, 43), 7)]]
fig, axes = plt.subplots(1, 4)
axes[0].imshow(img, cmap='gray')
axes[0].set_title("raw")
axes[1].imshow(imgs_smoothed[0], cmap="gray")
axes[1].set_title("5x5, 1")
axes[2].imshow(imgs_smoothed[1], cmap="gray")
axes[2].set_title("21x21, 3.5")
axes[3].imshow(imgs_smoothed[2], cmap="gray")
axes[3].set_title("43x43, 7")
plt.tight_layout()
plt.show()
Order-Statistic (Nonlinear) Filters
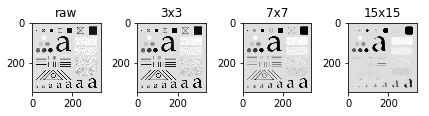
即\(g(x, y)\)由\((x, y)\)周围的点的一个某个顺序的值代替, 比如median.
imgs_smoothed = [cv2.medianBlur(img, ksize=ksize) for ksize in [3, 7, 15]]
fig, axes = plt.subplots(1, 4)
axes[0].imshow(img, cmap='gray')
axes[0].set_title("raw")
axes[1].imshow(imgs_smoothed[0], cmap="gray")
axes[1].set_title("3x3")
axes[2].imshow(imgs_smoothed[1], cmap="gray")
axes[2].set_title("7x7")
axes[3].imshow(imgs_smoothed[2], cmap="gray")
axes[3].set_title("15x15")
plt.tight_layout()
plt.show()

 浙公网安备 33010602011771号