K-means算法应用:图片压缩
-
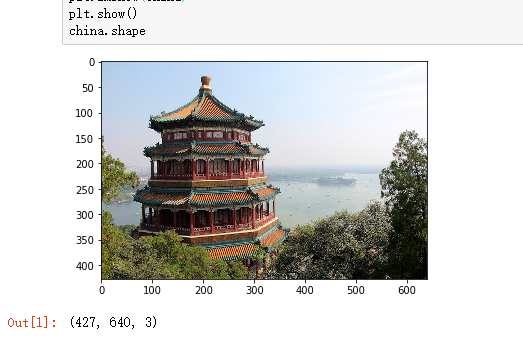
from sklearn.datasets import load_sample_image
from sklearn.cluster import KMeans
import matplotlib.pyplot as plt

china = load_sample_image("china.jpg")
plt.imshow(china)
plt.show()
china.shape
运行结果:
![]()
-
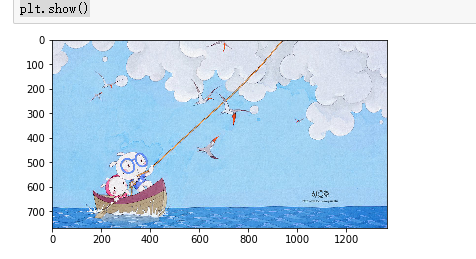
import matplotlib.image as img
cc = img.imread('C:\\Users\\HY\\Pictures\\cc.jpg')
plt.imshow(cc)
plt.show()
运行结果:
![]()
-
plt.imshow(cc[:,:,0])  #提取第三列颜色
plt.show
运行结果:
![]()
-
print(cc.shape)
cc
运行结果:
![]()
-
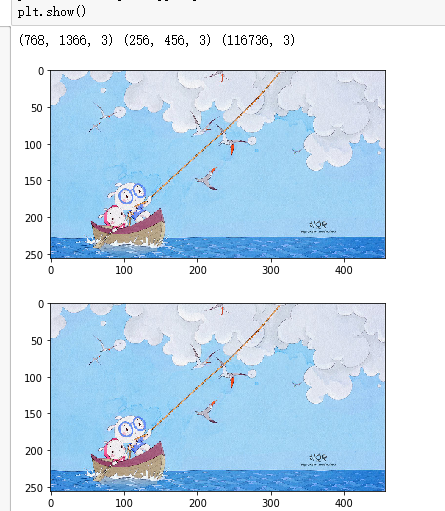
image = cc[::3, ::3]  #降低分辨率
X = image.reshape(-1,3)

import numpy as np
print(cc.shape,image.shape,X.shape)  #输出分辨率
n_colors = 64 #(256,256,256)
model = KMeans(n_colors)
labels = model.fit_predict(X)   #每个点的颜色分类,0-63
colors = model.cluster_centers_  #64个聚类中心,颜色值
plt.imshow(image);
plt.show()
plt.imshow(image.astype(np.uint8))
plt.show()
运行结果:
![]()
-
import sys
plt.imsave('C:\\Users\\HY\\Pictures\\image.jpg',image)  #保存图片
plt.imsave('C:\\Users\\HY\\Pictures\\cc.jpg',cc)
p1_size = sys.getsizeof('C:\\Users\\PC\\Desktop\\tp\\cc.jpg')  #压缩前后对比
p2_size = sys.getsizeof('C:\\Users\\PC\\Desktop\\tp\\image.jpg')
print('压缩前:'+str(p1_size),"\t压缩后:"+str(p2_size))
运行结果: #保存在C:\Users\\HY\Pictures 路径下的cc,image图
![]()
![]()
-
在M、N桶里分别抽出红球的概率运算结果如下图


 浙公网安备 33010602011771号