

python构建bp神经网络_曲线拟合(一个隐藏层)__1.可视化数据
1.将数据写入csv文件,应该可以python代码直接实现数据集的写入,但我对文件读取这块不太熟练,等我成功了再加上,这里我直接手写将数据集写入Excel
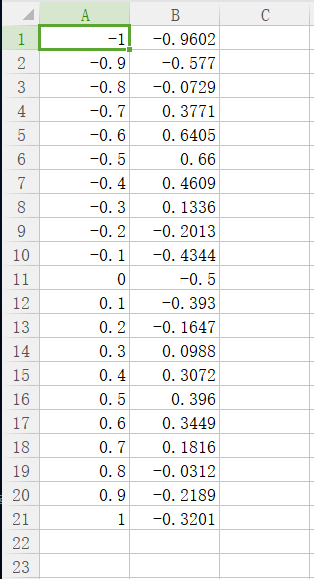
2.然后把后缀改成.csv就可以了,利用pandas读取
import matplotlib.pyplot as plt
file = 'bp_test.csv'
import pandas as pd
df = pd.read_csv(file, header=None)
x = df.iloc[:,].values
print(x)
读取结果
[[-1.     -0.9602]
 [-0.9    -0.577 ]
 [-0.8    -0.0729]
 [-0.7     0.3771]
 [-0.6     0.6405]
 [-0.5     0.66  ]
 [-0.4     0.4609]
 [-0.3     0.1336]
 [-0.2    -0.2013]
 [-0.1    -0.4344]
 [ 0.     -0.5   ]
 [ 0.1    -0.393 ]
 [ 0.2    -0.1647]
 [ 0.3     0.0988]
 [ 0.4     0.3072]
 [ 0.5     0.396 ]
 [ 0.6     0.3449]
 [ 0.7     0.1816]
 [ 0.8    -0.0312]
 [ 0.9    -0.2189]
 [ 1.     -0.3201]]
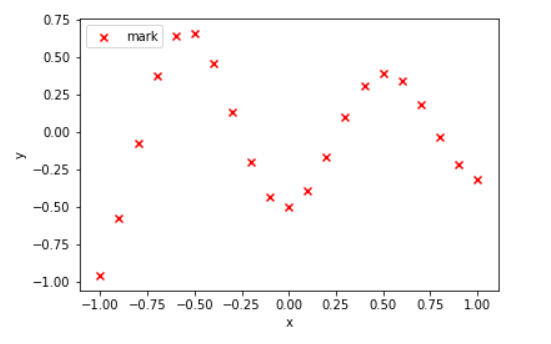
3.将21个数据可视化
plt.scatter(x[:,0], x[:,1], color='red', marker='x', label='mark')
plt.xlabel('x')
plt.ylabel('y')
plt.legend(loc='upper left')
plt.show()
运行结果

 浙公网安备 33010602011771号