[Matlab] 画图命令
matlab画图命令,不定时更新以便查找

set(gcf, 'color', [1 1 1]); % 使图背景为白色
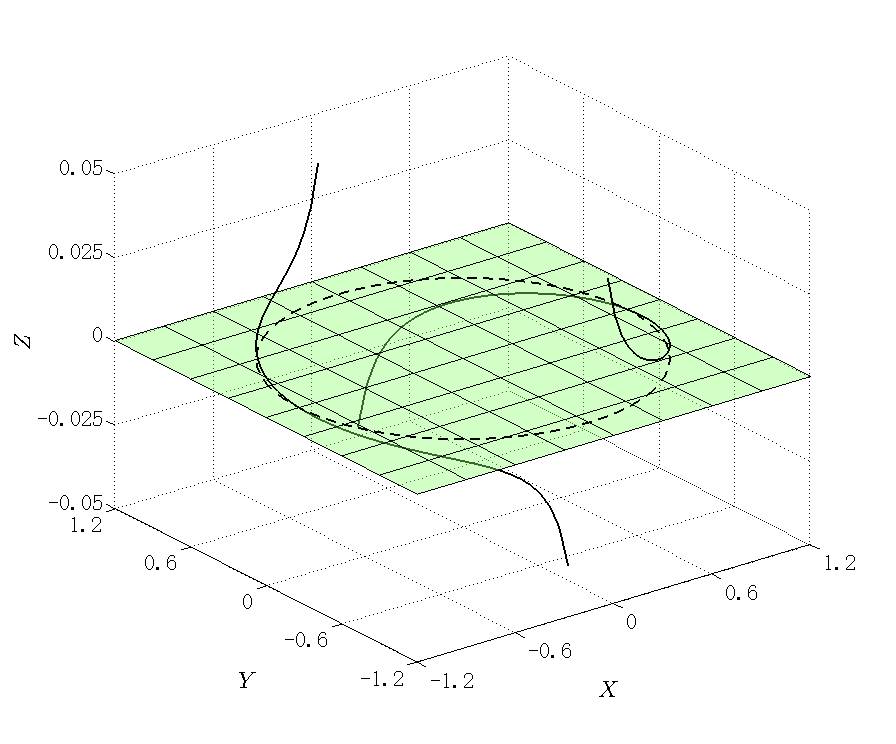
alpha(0.4); %设置平面透明度
plot(Circle1,Circle2,'k--','linewidth',1.25); % 'k--'设置线型 ‘linewidth’,1.25 设置线宽度为1.25
%线型 ‘.’ 点
% ‘-’ 线
% '--' 虚线
%‘linewidth’,1.25 可以设置曲线,grid,mesh,surf
fillt(Circle1,Circle2); %填充
figure('NumberTitle', 'off', 'Name', '原始数据'); % set figure title
zlim([-0.05,0.05])
xlim([-1.2,1.2])
ylim([-1.2,1.2]) %设置坐标轴范围
set(gca,'ztick',-0.05:0.025:0.05) %设置坐标轴刻度,步长
set(gca,'FontSize',14,'Fontname', 'Arial '); %设置坐标轴字体大小和字体
关于LaTeX字体
xlabel('$X$','interpreter','latex','FontSize',17)
ylabel('$Y$','interpreter','latex','FontSize',17)
zlabel('$Z$','interpreter','latex','FontSize',17)   %LaTeX字体给坐标轴上标签


Matlab图形中title、xlabel、ylabel、zlabel、textbox和legend等的Interpreter属性有三个属性:latex 、tex、none。默认为tex。
 set(text,'Interpreter')将属性设置为LaTeX。

例如

1. 在图象中直接加字符
text('Interpreter','latex','String','$$\sqrt{x^2+y^2}$$','Position',[.5.5],… 'FontSize',16);
2.  在legend里加数学字符
h=legend('$$\sqrt{x^2+y^2}$$');
set(h,'Interpreter','latex')
在画实验数据时 二维图的右边和上边box的刻度是不需要的
去除方法
box off
ax2 = axes('Position',get(gca,'Position'),...
'XAxisLocation','top',...
'YAxisLocation','right',...
'Color','none',...
'XColor','k','YColor','k');
set(ax2,'YTick', []);
set(ax2,'XTick', []);
box on
---------------------
作者:zqliu133
来源:CSDN
原文:https://blog.csdn.net/zqliu133/article/details/60867771
版权声明:本文为博主原创文章,转载请附上博文链接!


 浙公网安备 33010602011771号