3.3
import numpy as np
from scipy.sparse.linalg import eigs
import pylab as plt
w = np.array([[0, 1, 0, 1, 1, 1],
[0, 0, 0, 1, 1, 1],
[1, 1, 0, 1, 0, 0],
[0, 0, 0, 0, 1, 1],
[0, 0, 1, 0, 0, 1],
[0, 0, 1, 0, 0, 0]])
r = np.sum(w, axis=1, keepdims=True)
n = w.shape[0]
d = 0.85
P = (1 - d) / n + d * w / r
w, v = eigs(P.T, 1)
v = v / sum(v)
v = v.real
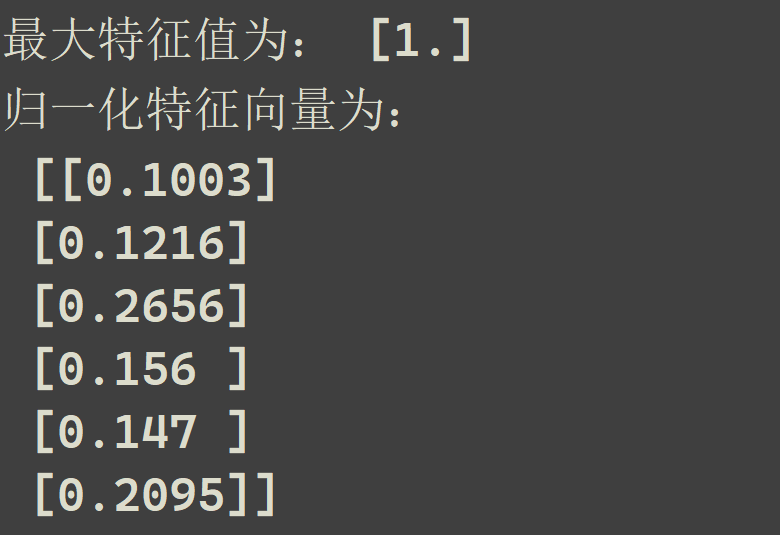
print("最大特征值为:", w.real)
print("归一化特征向量为:\n", np.round(v, 4))
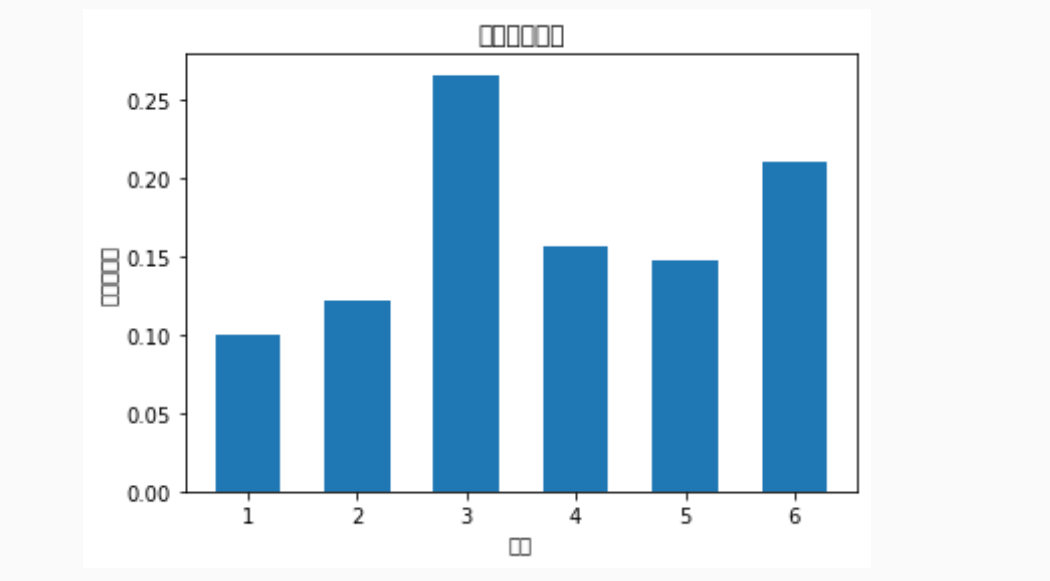
plt.bar(range(1, n + 1), v.flatten(), width=0.6)
plt.xlabel('索引')
plt.ylabel('特征向量值')
plt.title('特征向量分布')
plt.show()
print("学号:3022")


