2.6
import pandas as pd
import numpy as np
x = np.arange(0, 101, 1)
y = np.arange(0, 101, 1)
z = np.random.randint(0, 1001, size=(101, 101))
df = pd.DataFrame(data=z, index=x, columns=y)
df.to_excel('data.xlsx')
import pandas as pd
import numpy as np
import matplotlib.pyplot as plt
from scipy.interpolate import RectBivariateSpline
df = pd.read_excel('data.xlsx', header=None)
x = df.iloc[1:, 0].values
y = df.iloc[0, 1:].values
z = df.iloc[1:, 1:].values
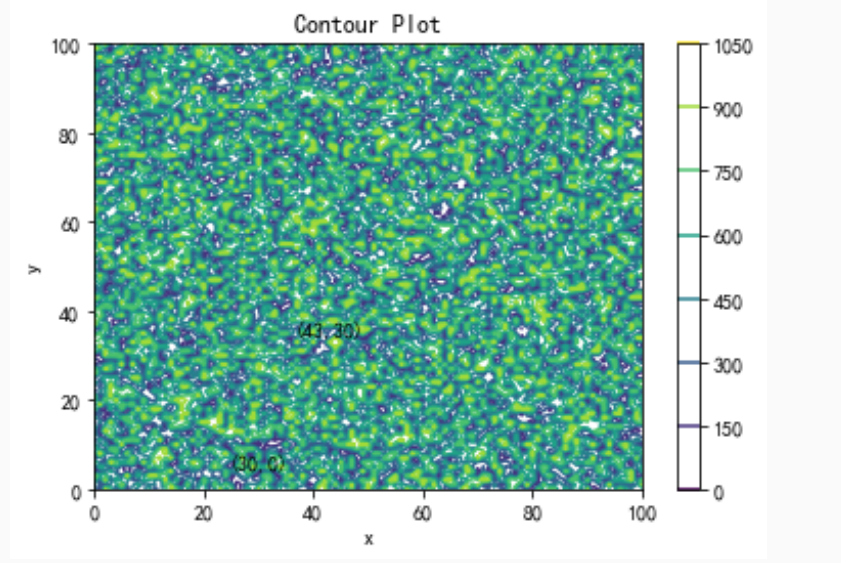
plt.contour(x, y, z)
plt.xlabel('x')
plt.ylabel('y')
plt.title('Contour Plot')
plt.colorbar()
point1 = (30, 0)
point2 = (43, 30)
plt.annotate('(30,0)', point1, textcoords="offset points", xytext=(0,10), ha='center')
plt.annotate('(43,30)', point2, textcoords="offset points", xytext=(0,10), ha='center')
interp_func = RectBivariateSpline(x, y, z)

3022


