1:Numpy 的基本操作
一:Numpy 的优势
1 Numpy介绍
Numpy(Numerical Python)是一个开源的Python科学计算库,用于快速处理任意维度的数组。
Numpy支持常见的数组和矩阵操作。对于同样的数值计算任务,使用Numpy比直接使用Python要简洁的多。
Numpy使用ndarray对象来处理多维数组,该对象是一个快速而灵活的大数据容器
2 ndarray介绍
NumPy提供了一个N维数组类型ndarray,它描述了相同类型的“items”的集合。
import numpy as np
score = np.array(
[[80, 89, 86, 67, 79],
[78, 97, 89, 67, 81],
[90, 94, 78, 67, 74],
[91, 91, 90, 67, 69],
[76, 87, 75, 67, 86],
[70, 79, 84, 67, 84],
[94, 92, 93, 67, 64],
[86, 85, 83, 67, 80]]
)

score
返回结果
array([[80, 89, 86, 67, 79],
       [78, 97, 89, 67, 81],
       [90, 94, 78, 67, 74],
       [91, 91, 90, 67, 69],
       [76, 87, 75, 67, 86],
       [70, 79, 84, 67, 84],
       [94, 92, 93, 67, 64],
       [86, 85, 83, 67, 80]])
3 ndarray与Python原生list运算效率对比
import random
import time
import numpy as np
a = []
for i in range(100000000):
    a.append(random.random())

# 通过%time魔法方法, 查看当前行的代码运行一次所花费的时间
%time sum1=sum(a)

b=np.array(a)

%time sum2=np.sum(b)
其中第一个时间显示的是使用原生Python计算时间,第二个内容是使用numpy计算时间:
CPU times: user 852 ms, sys: 262 ms, total: 1.11 s
Wall time: 1.13 s
CPU times: user 133 ms, sys: 653 µs, total: 133 ms
Wall time: 134 ms
Numpy专门针对ndarray的操作和运算进行了设计,所以数组的存储效率和输入输出性能远优于Python中的嵌套列表,数组越大,Numpy的优势就越明显。
4 ndarray的优势
4.1 内存块风格
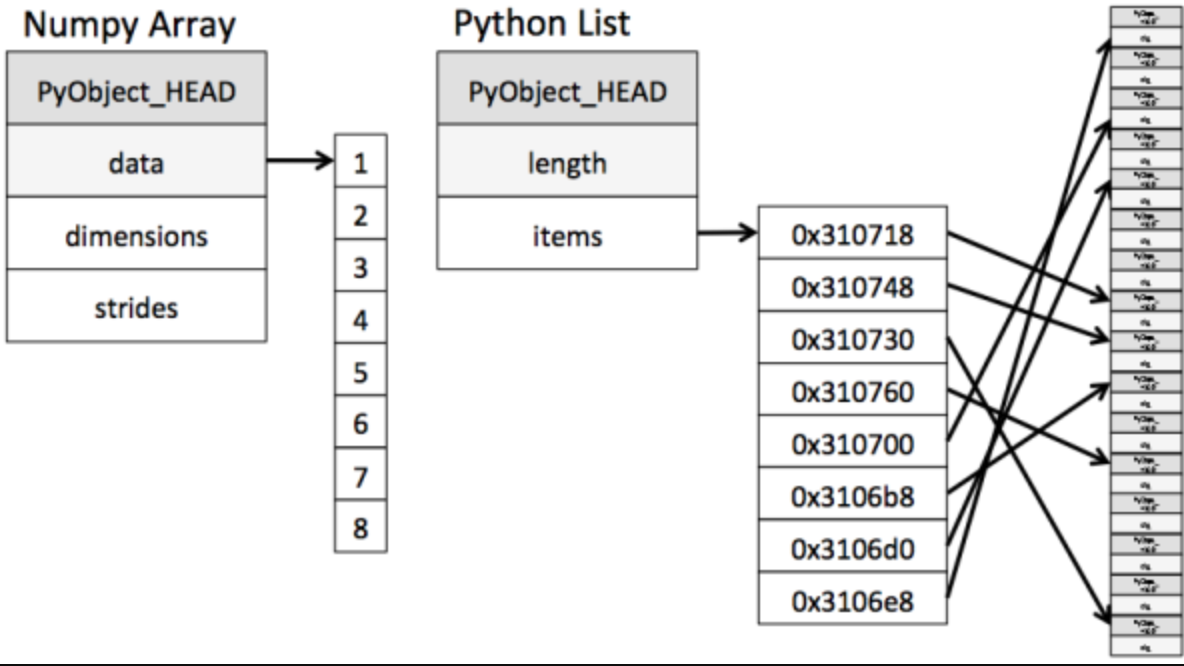
ndarray到底跟原生python列表有什么不同呢,请看一张图:

从图中我们可以看出ndarray在存储数据的时候,数据与数据的地址都是连续的,这样就给使得批量操作数组元素时速度更快。
这是因为ndarray中的所有元素的类型都是相同的,而Python列表中的元素类型是任意的,所以ndarray在存储元素时内存可以连续,而python原生list就只能通过寻址方式找到下一个元素,这虽然也导致了在通用性能方面Numpy的ndarray不及Python原生list,但在科学计算中,Numpy的ndarray就可以省掉很多循环语句,代码使用方面比Python原生list简单的多
4.2 ndarray支持并行化运算(向量化运算)
4.3 效率远高于纯Python代码
Numpy底层使用C语言编写,内部解除了GIL(全局解释器锁),其对数组的操作速度不受Python解释器的限制,所以,其效率远高于纯Python代码
二: N维数组-ndarray
1 ndarray的属性
数组属性反映了数组本身固有的信息。
| 属性名字 | 属性解释 |
|---|---|
| ndarray.shape | 数组维度的元组 |
| ndarray.ndim | 数组维数 |
| ndarray.size | 数组中的元素数量 |
| ndarray.itemsize | 一个数组元素的长度(字节) |
| ndarray.dtype | 数组元素的类型 |
先创建一些数组
a = np.array([[1,2,3],[4,5,6]])
b= np.array([1,2,3,4])
c = np.array([[[1,2,3],
         [43,5,6]],
        [[12,23,45],
         [1,2,3]]])
分别打印形状
a.shape
(2, 3)
b.shape
(4,)
c.shape
(2, 2, 3)  三维,简单理解,两行三列两层
打印维数
a.ndim
2
b.ndim
1
c.ndim
3
打印元素数量
a.size
6
b.size
b.size
4
c.size
c.size
12
3 ndarray的类型
type(a.dtype)
numpy.dtype
dtype是numpy.dtype类型,先看看对于数组来说都有哪些类型
| 名称 | 描述 | 简写 |
|---|---|---|
| np.bool | 用一个字节存储的布尔类型(True或False) | 'b' |
| np.int8 | 一个字节大小,-128 至 127 | 'i' |
| np.int16 | 整数,-32768 至 32767 | 'i2' |
| np.int32 | 整数,-2 31 至 2 32 -1 | 'i4' |
| np.int64 | 整数,-2 63 至 2 63 - 1 | 'i8' |
| np.uint8 | 无符号整数,0 至 255 | 'u' |
| np.uint16 | 无符号整数,0 至 65535 | 'u2' |
| np.uint32 | 无符号整数,0 至 2 ** 32 - 1 | 'u4' |
| np.uint64 | 无符号整数,0 至 2 ** 64 - 1 | 'u8' |
| np.float16 | 半精度浮点数:16位,正负号1位,指数5位,精度10位 | 'f2' |
| np.float32 | 单精度浮点数:32位,正负号1位,指数8位,精度23位 | 'f4' |
| np.float64 | 双精度浮点数:64位,正负号1位,指数11位,精度52位 | 'f8' |
| np.complex64 | 复数,分别用两个32位浮点数表示实部和虚部 | 'c8' |
| np.complex128 | 复数,分别用两个64位浮点数表示实部和虚部 | 'c16' |
| np.object_ | python对象 | 'O' |
| np.string_ | 字符串 | 'S' |
| np.unicode_ | unicode类型 | 'U' |
>>> type(score.dtype)
<type 'numpy.dtype'>
dtype是numpy.dtype类型,先看看对于数组来说都有哪些类型
创建数组的时候指定类型
>>> a = np.array([[1, 2, 3],[4, 5, 6]], dtype=np.float32)
>>> a.dtype
dtype('float32')

>>> arr = np.array(['python', 'tensorflow', 'scikit-learn', 'numpy'], dtype = np.string_)
>>> arr
array([b'python', b'tensorflow', b'scikit-learn', b'numpy'], dtype='|S12')
三:基本操作
1 生成数组的方法
1.1 生成0和1的数组
- np.ones(shape[, dtype, order])
- np.ones_like(a[, dtype, order, subok])
- np.zeros(shape[, dtype, order])
- np.zeros_like(a[, dtype, order, subok])
全零数组
import numpy as np
#默认浮点数
x = np.zeros(5)
x
array([0., 0., 0., 0., 0.])
)
np.zeros((2,3))
array([[0., 0., 0.],
       [0., 0., 0.]])
#指定数据类型
#指定数据类型
np.zeros((3,2),dtype=np.int)
array([[0, 0],
       [0, 0],
       [0, 0]])
全一数组
np.ones(5)
array([1., 1., 1., 1., 1.])

np.ones((2,3),dtype=int)
array([[1, 1, 1],
       [1, 1, 1]])

np.ones((3,3))
array([[1., 1., 1.],
       [1., 1., 1.],
       [1., 1., 1.]])
1.2 从现有数组生成
1.2.1 生成方式
-
np.array(object[, dtype, copy, order, subok, ndmin])
-
np.asarray(a[, dtype, order])
a = np.array([[1,2,3,],[4,5,6]])
a
array([[1, 2, 3],
       [4, 5, 6]])

#从现有数组中创建
a1 = np.array(a)
a1
array([[1, 2, 3],
       [4, 5, 6]])

#相当于索引的形式,并没有创建一个新的
a2 = np.asarray(a)
a2
array([[1, 2, 3],
       [4, 5, 6]])

data = np.ones([3,4])
data
array([[1., 1., 1., 1.],
       [1., 1., 1., 1.],
       [1., 1., 1., 1.]])

data1 = np.array(data)
data1
array([[1., 1., 1., 1.],
       [1., 1., 1., 1.],
       [1., 1., 1., 1.]])

data2 = np.asarray(data)
data2
array([[1., 1., 1., 1.],
       [1., 1., 1., 1.],
       [1., 1., 1., 1.]])

data[1] =2
data1
array([[1., 1., 1., 1.],
       [1., 1., 1., 1.],
       [1., 1., 1., 1.]])
#相当于索引的形式,并没有创建一个新的
data2
array([[1., 1., 1., 1.],
       [2., 2., 2., 2.],
       [1., 1., 1., 1.]])
1.3 生成固定范围的数组

np.linspace (start, stop, num, endpoint)
生成等间隔的序列
    start 序列的起始值
    stop 序列的终止值,
    num 要生成的等间隔样例数量,默认为50,等差数列的n
    endpoint 序列中是否包含stop值,默认为ture
np.linspace(0,100,11)
array([  0.,  10.,  20.,  30.,  40.,  50.,  60.,  70.,  80.,  90., 100.])
2:等比数列
通项式:
定义式:
np.logspace(start, stop, num=50, endpoint=True, base=10.0, dtype=None)
#base为公比
#start 为2**1(公比的开始次幂)   stop为 2**4(公比的结束次幂)

np.logspace(1,4,4,base=2)
array([ 2.,  4.,  8., 16.]
3:创建数值范围
numpy.arange(start, stop, step, dtype)

生成 0 到 5 的数组:
x = np.arange(5)
print (x)
[0  1  2  3  4]

x = np.arange(10,20,2)
print (x)
[10  12  14  16  18]
1.4 生成随机数组
1.4.1 使用模块 numpy.random
1.4.2 均匀分布
-
np.random.rand(d0, d1, ..., dn)
返回[0.0,1.0)内的一组均匀分布的数。
-
np.random.uniform(low=0.0, high=1.0, size=None)
功能:从一个均匀分布[low,high)中随机采样,注意定义域是左闭右开,即包含low,不包含high.
参数介绍:
low: 采样下界,float类型,默认值为0;
high: 采样上界,float类型,默认值为1;
size: 输出样本数目,为int或元组(tuple)类型,例如,size=(m,n,k), 则输出mnk个样本,缺省时输出1个值。
返回值:ndarray类型,其形状和参数size中描述一致。
-
np.random.randint(low, high=None, size=None, dtype='l')
从一个均匀分布中随机采样,生成一个整数或N维整数数组,取数范围:若high不为None时,取[low,high)之间随机整数,否则取值[0,low)之间随机整数。
#0-1 之间的随机数
np.random.random(10)
array([0.58642629, 0.51214632, 0.76252462, 0.38890836, 0.7092395 ,
       0.76141558, 0.21026725, 0.38082882, 0.11464903, 0.3109624 ])

#均匀分布
a= np.random.rand(100000000)
a
array([0.55804123, 0.37838796, 0.93754123, ..., 0.04794784, 0.70356713,
       0.1009433 ])


np.random.uniform(-1,1,(2,3))
array([[ 0.52643694,  0.43697993,  0.02987183],
       [-0.00957113,  0.40578055, -0.9273382 ]])
b = np.random.uniform(-2,2,100000000)
b
array([-1.54146427, -0.3494291 ,  0.86939567, ...,  1.72257082,
       -0.30061801,  1.58459804])

# 2)绘制直方图
plt.hist(x=b, bins=1000)  # x代表要使用的数据,bins表示要划分区间数

# 3)显示图像
plt.show()

1.4.3 正态分布
1.4.3.1 基础概念复习:正态分布(理解)
a. 什么是正态分布
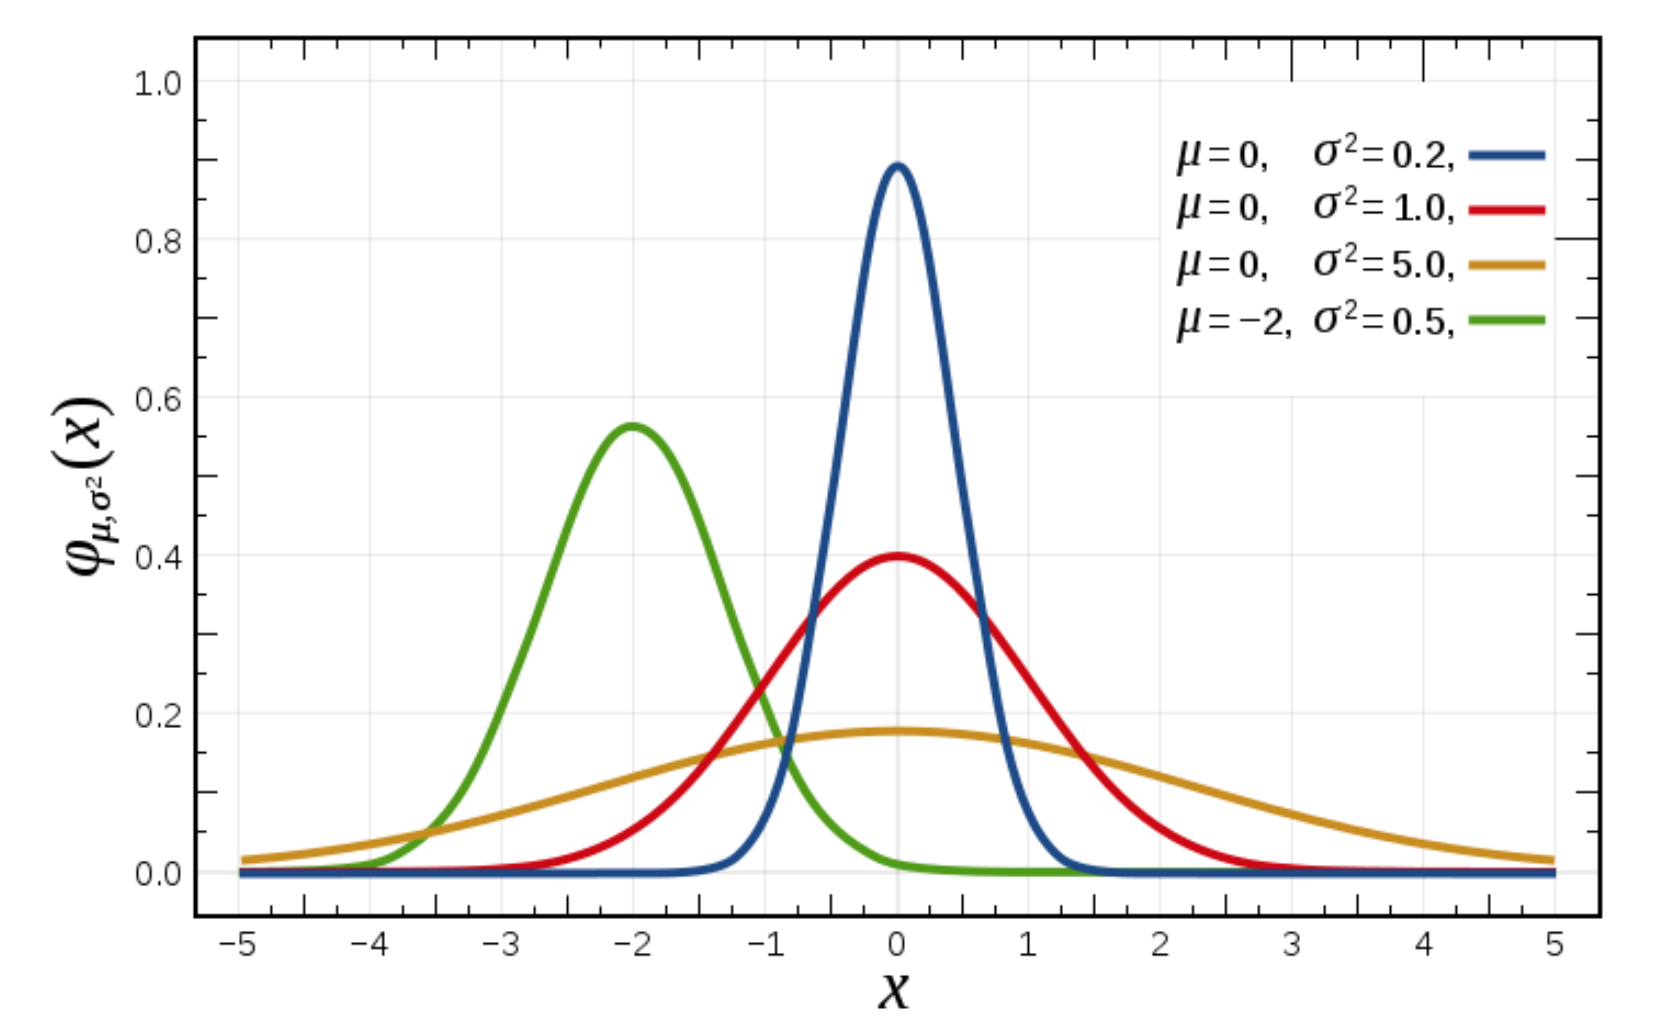
正态分布是一种概率分布。正态分布是具有两个参数μ和σ的连续型随机变量的分布,第一参数μ是服从正态分布的随机变量的均值,第二个参数σ是此随机变量的方差,所以正态分布记作N(μ,σ )。

b. 正态分布特点
μ决定了其位置,其标准差σ决定了分布的幅度。当μ = 0,σ = 1时的正态分布是标准正态分布

标准差如何来?
-
方差
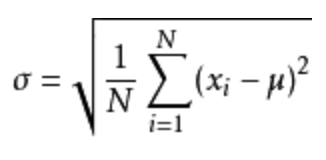
是在概率论和统计方差衡量一组数据时离散程度的度量

其中M为平均值,n为数据总个数,S为标准差,S^2可以理解一个整体为方差


-
标准差与方差的意义
可以理解成数据的一个离散程度的衡量
1.4.3.2 正态分布创建方式
-
np.random.randn(d0, d1, …, dn)
功能:从标准正态分布中返回一个或多个样本值
-
np.random.normal(loc=0.0, scale=1.0, size=None)
loc:float
此概率分布的均值(对应着整个分布的中心centre)
scale:float
此概率分布的标准差(对应于分布的宽度,scale越大越矮胖,scale越小,越瘦高)
size:int or tuple of ints
输出的shape,默认为None,只输出一个值
-
np.random.standard_normal(size=None)
返回指定形状的标准正态分布的数组。
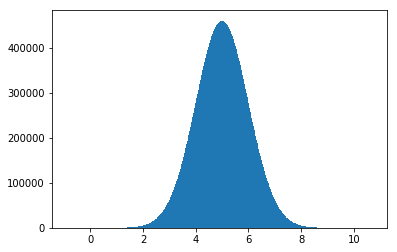
d = np.random.normal(5,1,100000000)
d
array([3.62686127, 6.03391888, 5.53440349, ..., 4.76027627, 6.4010736 ,
       5.50637133])

# 2)绘制直方图
plt.hist(d, 1000)

# 3)显示图像
plt.show()

案例:随机生成8只股票2周的交易日涨幅数据
8只股票,两周(10天)的涨跌幅数据,如何获取?
- 两周的交易日数量为:2 X 5 =10
- 随机生成涨跌幅在某个正态分布内,比如均值0,方差1
股票涨跌幅数据的创建
# 创建符合正态分布的8只股票10天的涨跌幅数据
stock_change = np.random.normal(0, 1, (8, 10))
stock_change

array([[-1.16145614, -0.4813283 ,  0.47005296,  0.75900298,  0.16025889,
         1.77487311,  1.85629649, -1.32643171,  1.71446728,  2.03189396],
       [-1.38000074, -0.81202819,  1.6932091 ,  0.58275772,  0.41881986,
         0.0196576 ,  0.36389329, -0.70326838, -0.60161625, -0.14893818],
       [-0.68546752,  0.13903659, -0.23841334, -1.57744753, -0.26111981,
         0.33717914, -0.83865134,  0.31583026, -0.32670344, -0.28907657],
       [ 2.8893417 ,  1.46912829,  1.05087107, -0.85067533,  1.28812623,
        -0.67675537, -0.52241439, -0.35664069, -0.61919503,  1.09939695],
       [ 1.13450239, -1.04822501, -0.47229946,  0.74965922, -0.7631378 ,
        -1.11829027, -0.47172127, -0.11108742, -0.89242139, -0.35443916],
       [-0.71144486,  0.01491591, -1.521441  ,  2.30788143, -1.30918991,
         1.44788467,  1.11374219, -0.87217971,  0.85362762, -1.66443075],
       [-1.60816351, -1.30100154,  0.64751315, -0.37585952,  0.35045343,
         1.48083844, -0.49726612,  0.40992677,  0.29296538,  0.00323962],
       [-0.4358215 , -0.06240266, -0.0291547 ,  1.04090328,  1.09629484,
         1.71422351, -1.99822576, -0.0269075 , -0.00550593, -0.37989271]])
2 数组的索引、切片
- 获取第一个股票的前3个交易日的涨跌幅数据
# 二维的数组,两个维度
stock_change[0, 0:3]
返回结果:

array([-0.03862668, -1.46128096, -0.75596237])
一维、二维、三维的数组如何索引?(从宏观到微观)
# 三维,一维
a1 = np.array([ [[1,2,3],[4,5,6]], [[12,3,34],[5,6,7]]])
# 返回结果
array([[[ 1,  2,  3],
        [ 4,  5,  6]],

       [[12,  3, 34],
        [ 5,  6,  7]]])
# 索引、切片
>>> a1[0, 0, 1]   # 输出: 2
3 形状修改
让刚才的股票行、日期列反过来,变成日期行,股票列
- ndarray.reshape(shape[, order]) Returns an array containing the same data with a new shape.
# 在转换形状的时候,一定要注意数组的元素匹配
stock_change.reshape([10, 8])
stock_change.reshape([-1,20])  # 数组的形状被修改为: (4, 20), -1: 表示通过待计算
- ndarray.resize(new_shape[, refcheck]) Change shape and size of array in-place.
stock_change.resize([10, 8])
- ndarray.T 数组的转置
- 将数组的行、列进行互换
stock_change.shape
(10, 8)
stock_change.T.shape
(8, 10)
4 类型修改
- ndarray.astype(type)
stock_change.astype(np.int32)
- ndarray.tostring([order])或者ndarray.tobytes([order]) Construct Python bytes containing the raw data bytes in the array.
- 转换成bytes
arr = np.array([[[1, 2, 3], [4, 5, 6]], [[12, 3, 34], [5, 6, 7]]])
arr.tostring()
拓展:如果遇到
IOPub data rate exceeded.
    The notebook server will temporarily stop sending output
    to the client in order to avoid crashing it.
    To change this limit, set the config variable
    `--NotebookApp.iopub_data_rate_limit`.
这个问题是在jupyer当中对输出的字节数有限制,需要去修改配置文件
创建配置文件
jupyter notebook --generate-config
vi ~/.jupyter/jupyter_notebook_config.py
取消注释,多增加
## (bytes/sec) Maximum rate at which messages can be sent on iopub before they
#  are limited.
c.NotebookApp.iopub_data_rate_limit = 10000000
但是不建议这样去修改,jupyter输出太大会崩溃
5 数组的去重
- np.unique()
temp = np.array([[1, 2, 3, 4],[3, 4, 5, 6]])
>>> np.unique(temp)
array([1, 2, 3, 4, 5, 6])


