研究一下加速梯度下降的方法(试图找到一种不会收敛于局部最优的方法)
研究一下加速梯度下降的方法(试图找到一种不会收敛于局部最优的方法)
发现自己很久没有更新了,现在又在学习着机器学习的内容,正好对梯度下降这里比较感兴趣,因此写了一篇短短的ipynb来实现一下
另外:本文的代码都是基于python3.9
介绍:
本文章主要是对梯度下降(从一个简单的例子出发)的一些方法进行实现,并且对比一下不同方法的收敛速度,以及收敛的精度,最后对比一下不同方法的优缺点
import matplotlib.pyplot as plt
import numpy as np
import latexify
一维损失函数及其导数
@latexify.function
def J(x):
    return 1/4 * x**4 - 5/3 * x**3 + 3 * x**2 + 1

J
@latexify.function
def grad_J(x):
    return x**3 - 5 * x**2 + 6 * x

grad_J
# 画出两个函数的图像
x = np.linspace(-2, 5, 100)
plt.figure(figsize=(8, 6))
plt.plot(x, J(x), label='J(x)')
plt.plot(x, grad_J(x), label='grad_J(x)')
plt.legend()
plt.xlabel('x')
plt.ylabel('y')
plt.title('J(x) and grad_J(x)')
plt.ylim(-5, 30)
plt.show()
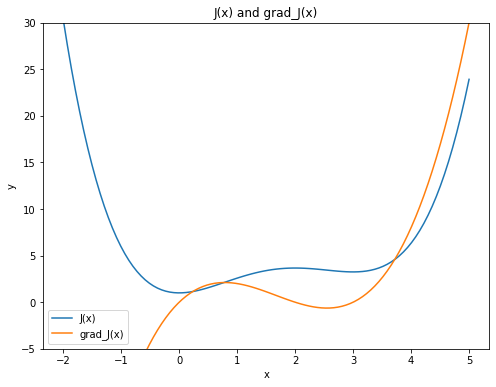
函数说明
这里有意定义了这样一个一维函数,从或者进行梯度下降,观察其是否能够收敛到最小值点,正常的梯度下降会收敛到局部最优点。
x0 = 4
梯度下降
alpha = 0.1
x = x0
for i in range(350):
    x = x - alpha * grad_J(x)
print(x)
3.0000000000000004
我们可以发现,如果单纯只调整学习率的话,很容易陷入局部最优,为此我们思考必须多引入一些参数来调整,这样才能使得梯度下降能够收敛到全局最优
引入动量的梯度下降
alpha = 0.1
beta = -0.74
prex = x0
x = prex - alpha * grad_J(prex)
for i in range(350):
    tmp = x
    x = x - alpha * grad_J(x) - beta * (x - prex) # 这里引入了动量的概念
    prex = tmp
print(x)
-2.0281455138975658e-23
这里我们仅仅是在梯度下降的基础上,引入了动量,并且将动量的系数设置为-0.74,这样就能够使得梯度下降能够收敛到全局最优
下面我们试着自己写一种方法,来实现梯度下降,并且使得梯度下降能够收敛到全局最优,从而更好的理解上面动量的方法是多么的有效.
尝试
希望模拟现实世界中的受重力的影响,使得小球可以像真实世界中的小球一样,在下坡的时候加速,在上坡的时候减速,从而使得小球能够更快的到达最低点
注:这里的尝试构造均失败了,下面的代码为失败尝试代码,可以跳过直接看下一个二级标题"成功案例",这里只是为了记录一下自己的失败尝试
demo1
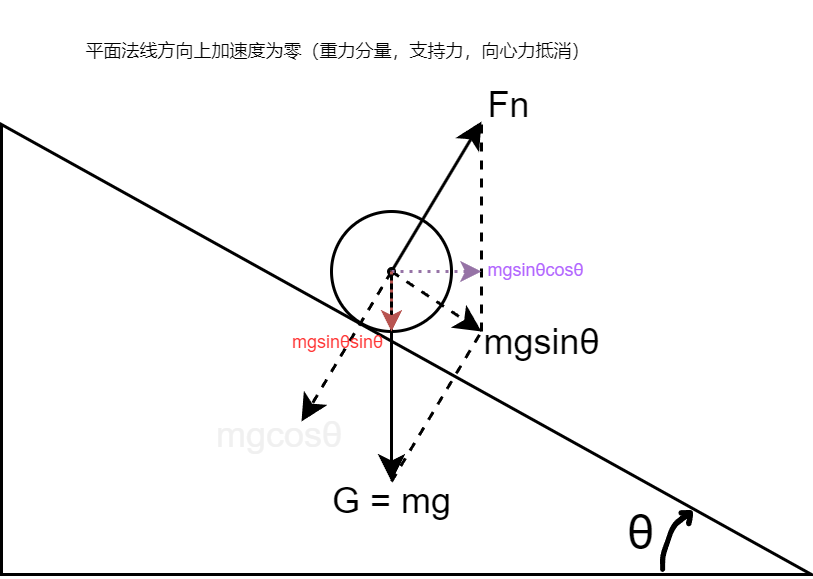
施加一个重力加速度的方法来试一下;
x = x0
v = 0
dt = 0.1
g = 4.9
x_history = np.array([])
v_history = np.array([])
for i in range(50):
    tan_theta = -grad_J(x)
    a = g * tan_theta / (1 + tan_theta**2)
    x = x + v * dt
    v = v + a * dt
    x_history = np.append(x_history, x)
    v_history = np.append(v_history, v)
for i in range(50):
    print("该点的位置为:", x_history[i], "该点的速度为:", v_history[i],end=' ')
    print("该点的梯度为:", grad_J(x_history[i]), end=' ')
    a = g * (-grad_J(x_history[i])) / (1 + (-grad_J(x_history[i]))**2)
    print("该点的加速度为:", a)
该点的位置为: 4.0 该点的速度为: -0.06030769230769231 该点的梯度为: 8.0 该点的加速度为: -0.6030769230769231
该点的位置为: 3.9939692307692307 该点的速度为: -0.12061538461538462 该点的梯度为: 7.915823602671683 该点的加速度为: -0.6092895887825014
该点的位置为: 3.981907692307692 该点的速度为: -0.18154434349363477 该点的梯度为: 7.748993091307142 该点的加速度为: -0.6219819503263747
该点的位置为: 3.9637532579583286 该点的速度为: -0.24374253852627226 该点的梯度为: 7.501694773653753 该点的加速度为: -0.6417814398848021
该点的位置为: 3.9393790041057013 该点的速度为: -0.30792068251475246 该点的梯度为: 7.176807617072736 该点的加速度为: -0.6697515939337939
该点的位置为: 3.9085869358542262 该点的速度为: -0.37489584190813185 该点的梯度为: 6.777947660631952 该点的加速度为: -0.7075316801668794
该点的位置为: 3.871097351663413 该点的速度为: -0.4456490099248198 该点的梯度为: 6.309532339945356 该点的加速度为: -0.7575730997795793
该点的位置为: 3.826532450670931 该点的速度为: -0.5214063199027777 该点的梯度为: 5.776871433676213 该点的加速度为: -0.8235328012439239
该点的位置为: 3.774391818680653 该点的速度为: -0.6037596000271701 该点的梯度为: 5.1862955794418255 该点的加速度为: -0.910931119870869
该点的位置为: 3.714015858677936 该点的速度为: -0.694852712014257 该点的梯度为: 4.545340760418615 该点的加速度为: -1.0282568620792585
该点的位置为: 3.6445305874765106 该点的速度为: -0.7976783982221829 该点的梯度为: 3.8630211644357146 该点的加速度为: -1.1887762311163803
该点的位置为: 3.5647627476542922 该点的速度为: -0.916556021333821 该点的梯度为: 3.150251097270754 该点的加速度为: -1.4130460033844363
该点的位置为: 3.47310714552091 该点的速度为: -1.0578606216722646 该点的梯度为: 2.420538669106829 该点的加速度为: -1.729206385535076
该点的位置为: 3.3673210833536835 该点的速度为: -1.2307812602257722 该点的梯度为: 1.691223078893188 该点的加速度为: -2.1467584247219986
该点的位置为: 3.2442429573311062 该点的速度为: -1.4454571026979721 该点的梯度为: 0.9859175821627169 该点的加速度为: -2.449753619545018
该点的位置为: 3.099697247061309 该点的速度为: -1.690432464652474 该点的梯度为: 0.33984085035222833 该点的加速度为: -1.4928125526331761
该点的位置为: 2.9306540005960615 该点的速度为: -1.8397137199157916 该点的梯度为: -0.18913600341052472 该点的加速度为: 0.8947587248412011
该点的位置为: 2.7466826286044825 该点的速度为: -1.7502378474316715 该点的梯度为: -0.5195286489425222 该点的加速度为: 2.004622646955576
该点的位置为: 2.5716588438613153 该点的速度为: -1.549775582736114 该点的梯度为: -0.6297092687667476 该点的加速度为: 2.209452788274475
该点的位置为: 2.416681285587704 该点的速度为: -1.3288303039086664 该点的梯度为: -0.5873937001649026 该点的加速度为: 2.139897416936071
该点的位置为: 2.283798255196837 该点的速度为: -1.1148405622150592 该点的梯度为: -0.46419753785842843 该点的加速度为: 1.871334077154911
该点的位置为: 2.172314198975331 该点的速度为: -0.9277071544995681 该点的梯度为: -0.30981983002363833 该点的加速度为: 1.3851581532498636
该点的位置为: 2.079543483525374 该点的速度为: -0.7891913391745817 该点的梯度为: -0.15225651647309846 该点的加速度为: 0.729153656522082
该点的位置为: 2.000624349607916 该点的速度为: -0.7162759735223735 该点的梯度为: -0.0012483091600223872 该点的加速度为: 0.006116705352596022
该点的位置为: 1.9289967522556788 该点的速度为: -0.7156643029871139 该点的梯度为: 0.14668999656100112 该点的加速度为: -0.7036400873490546
该点的位置为: 1.8574303219569674 该点的速度为: -0.7860283117220194 该点的梯度为: 0.30256758178320986 该点的加速度为: -1.3582383154223672
该点的位置为: 1.7788274907847654 该点的速度为: -0.9218521432642561 该点的梯度为: 0.48044313995965204 该点的加速度为: -1.9126766336929208
该点的位置为: 1.6866422764583398 该点的速度为: -1.1131198066335481 该点的梯度为: 0.694138955327599 该点的加速度为: -2.2953263400772346
该点的位置为: 1.5753302957949848 该点的速度为: -1.3426524406412716 该点的梯度为: 0.9530969810530223 该点的加速度为: -2.447175772552617
该点的位置为: 1.4410650517308576 该点的速度为: -1.5873700178965333 该点的梯度为: 1.2556622691283117 该点的加速度为: -2.387850509502285
该点的位置为: 1.2823280499412042 该点的速度为: -1.8261550688467618 该点的梯度为: 1.580757817101249 该点的加速度为: -2.2138229567773235
该点的位置为: 1.099712543056528 该点的速度为: -2.0475373645244943 该点的梯度为: 1.8813936755152634 该点的加速度为: -2.030739137689519
该点的位置为: 0.8949588066040786 该点的速度为: -2.250611278293446 该点的梯度为: 2.0818149007696807 该点的加速度为: -1.9124451370769184
该点的位置为: 0.6698976787747339 该点的速度为: -2.441855792001138 该点的梯度为: 2.076196797558346 该点的加速度为: -1.9156738307084165
该点的位置为: 0.42571209957462014 该点的速度为: -2.6334231750719796 该点的梯度为: 1.7252707796790574 该点的加速度为: -2.12591495834866
该点的位置为: 0.16236978206742214 该点的速度为: -2.8460146709068455 该点的梯度为: 0.8466796699487636 该点的加速度为: -2.416454902544
该点的位置为: -0.12223168502326243 该点的速度为: -3.0876601611612453 该点的梯度为: -0.8099192471159296 该点的加速度为: 2.3965447801718853
该点的位置为: -0.43099770113938696 该点的速度为: -2.8480056831440566 该点的梯度为: -3.594843008664397 该点的加速度为: 1.2651628236956194
该点的位置为: -0.7157982694537925 该点的速度为: -2.7214894007744945 该点的梯度为: -7.223376957768395 该点的加速度为: 0.6655966081319048
该点的位置为: -0.987947209531242 该点的速度为: -2.654929739961304 该点的梯度为: -11.772157388252314 该点的加速度为: 0.41325438078454696
该点的位置为: -1.2534401835273725 该点的速度为: -2.613604301882849 该点的梯度为: -17.34549785130369 该点的加速度为: 0.28155822852498236
该点的位置为: -1.5148006137156576 该点的速度为: -2.585448479030351 该点的梯度为: -24.03780132538522 该点的加速度为: 0.20349342167111323
该点的位置为: -1.7733454616186926 该点的速度为: -2.5650991368632394 该点的梯度为: -31.94057885861099 该点的加速度为: 0.15325964340993375
该点的位置为: -2.0298553753050164 该点的速度为: -2.549773172522246 该点的梯度为: -41.14433565076403 该点的加速度为: 0.11902263374200511
该点的位置为: -2.284832692557241 该点的速度为: -2.5378709091480456 该点的梯度为: -51.73917698770582 该点的加速度为: 0.09467043200470807
该点的位置为: -2.5386197834720456 该点的速度为: -2.528403865947575 该点的梯度为: -63.8150354246082 该点的加速度为: 0.07676556204849665
该点的位置为: -2.791460170066803 该点的速度为: -2.520727309742725 该点的梯度为: -77.46176560396071 该点的加速度为: 0.06324647360488242
该点的位置为: -3.0435329010410754 该点的速度为: -2.514402662382237 该点的梯度为: -92.76918685399777 该点的加速度为: 0.052813125458644375
该点的位置为: -3.294973167279299 该点的速度为: -2.5091213498363727 该点的梯度为: -109.8271032806874 该点的加速度为: 0.044611882245952424
该点的位置为: -3.545885302262936 该点的速度为: -2.5046601616117776 该点的梯度为: -128.72531350559433 该点的加速度为: 0.038063254016984266
# 画出两个函数的图像 并且画出梯度下降的过程
x = np.linspace(-2, 5, 100)
plt.figure(figsize=(8, 6))
plt.plot(x, J(x), label='J(x)')
plt.plot(x, grad_J(x), label='grad_J(x)')
plt.plot(x_history, J(x_history), 'gx', label='gradient on J')
plt.plot(x_history, grad_J(x_history), 'bo', label='gradient on grad_J')
plt.legend()
plt.xlabel('x')
plt.ylabel('y')
# 显示x轴和y轴
plt.axhline(y=0, color='k')
plt.title('J(x) and grad_J(x)')
plt.ylim(-5, 30)
plt.xlim(-2, 5)
plt.show()
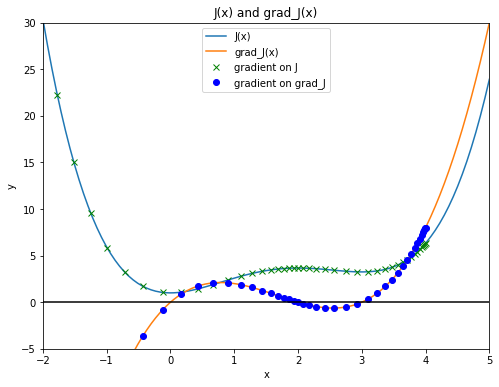
上述过程之所以不对(在上坡的时候没有正确地减速),是因为重力加速度垂直分量也会影响到速度的变化,所以不能简单的用重力加速度的水平分量来单纯的考虑对水平的速度影响。
demo2
我们改用另一种形式来模拟:
其中为小球的位置,为小球的速度,为小球的加速度,为重力加速度,为小球的倾斜角度,为时间步长。
x = 5
y = J(x)
v = 0
dt = 0.1
g = 9.8
x_history = np.array([x])
y_history = np.array([y])
# vx_history = np.array([0])
for i in range(20):
    tan_theta = -grad_J(x)
    v = v + g * dt * tan_theta/np.sqrt(1 + tan_theta**2)
    vx =  v / np.sqrt(1 + tan_theta**2 )
    vy = tan_theta * vx
    x = x + vx * dt
    y = y - vy * dt
    x_history = np.append(x_history, x)
    y_history = np.append(y_history, y)
    # vx_history = np.append(vx_history, vx)
for i in range(20):
    print("该点的水平位置为:", x_history[i],end=' ')
    print("该点的垂直位置为:", y_history[i])
    # print("该点的速度为:", v_history[i],end=' ')
    # print("该点的水平速度为:", vx_history[i])
该点的水平位置为: 5.0 该点的垂直位置为: 23.916666666666657
该点的水平位置为: 4.996736958934517 该点的垂直位置为: 23.81877543470217
该点的水平位置为: 4.990188857870097 该点的垂直位置为: 23.622994074195017
该点的水平位置为: 4.9802999571085955 该点的垂直位置为: 23.32932520551787
该点的水平位置为: 4.9669787641646055 该点的垂直位置为: 22.9377730908447
该点的水平位置为: 4.950094447132291 该点的垂直位置为: 22.448343852339754
该点的水平位置为: 4.929471368219252 该点的垂直位置为: 21.861045808035467
该点的水平位置为: 4.904881204477671 该点的垂直位置为: 21.175889965931184
该点的水平位置为: 4.876031819091466 该点的垂直位置为: 20.392890741727825
该点的水平位置为: 4.842551576864096 该点的垂直位置为: 19.51206700608363
该点的水平位置为: 4.803967037428693 该点的垂直位置为: 18.533443636180603
该点的水平位置为: 4.7596706774332365 该点的垂直位置为: 17.457053868955565
该点的水平位置为: 4.708873035305325 该点的垂直位置为: 16.282942981723167
该点的水平位置为: 4.650529504664026 该点的垂直位置为: 15.011174274309091
该点的水平位置为: 4.583223877822744 该点的垂直位置为: 13.641839262623602
该点的水平位置为: 4.5049738417594245 该点的垂直位置为: 12.175076094726261
该点的水平位置为: 4.4128855955312885 该点的垂直位置为: 10.611105359829928
该点的水平位置为: 4.3024902904813 该点的垂直位置为: 8.950306643044605
该点的水平位置为: 4.166328451861498 该点的垂直位置为: 7.193404356595626
该点的水平位置为: 3.990454788281292 该点的垂直位置为: 5.342007642502115
# 画出两个函数的图像 并且画出梯度下降的过程
x = np.linspace(-2, 5, 100)
plt.figure(figsize=(8, 6))
plt.plot(x, J(x), label='J(x)')
plt.plot(x, grad_J(x), label='grad_J(x)')
plt.plot(x_history, y_history, 'gx', label='gradient on J')
# plt.plot(x_history, grad_J(x_history), 'bo', label='gradient on grad_J')
plt.legend()
plt.xlabel('x')
plt.ylabel('y')
# 显示x轴和y轴
plt.axhline(y=0, color='k')
plt.title('J(x) and grad_J(x)')
plt.ylim(-5, 30)
plt.xlim(-2, 5)
plt.show()
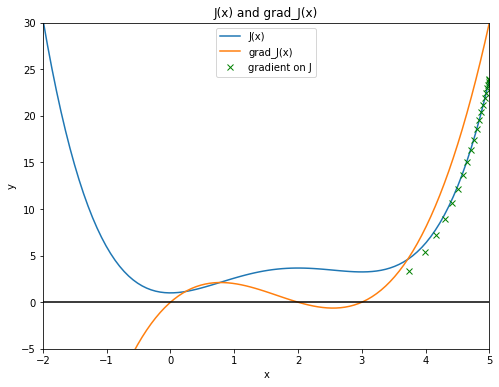
上述算法的缺点是没有正确地利用到损失函数每一刻的值,自顾自的开始运算,由于计算机浮点运算所带来的一系列误差导致我们最后的y值已经偏离了最小值点。
引入动能的梯度下降(成功案例)
这里综合上述的情况,决定采用能量守恒的形式来更新小球的位置,再后面还增加了摩檫力的因子,从而更快收敛到最小值点
我们采取的分析的角度是这样的:
x = 5
v_square = 0
vx = 0
dt = 0.05
g = 9.8

x_history = np.array([x])
for i in range(200):
    # print("该点的水平位置为:", x,end=' ')
    # print("该点的水平速度为:", vx,end=' ')
    # print("该点的动能为:", 0.5 * v_square)
    prex = x
    # update x
    x = x + dt * vx
    v_square +=  2 * g * (J(prex)-J(x))
    if v_square <= 0:
        v_square = 0
        vx = g * (-grad_J(x)) / (1 + (grad_J(x))**2) * dt
    else:
        if x - prex < 0:
            vx = -np.sqrt(v_square) / np.sqrt(1 + (grad_J(x))**2 )
        else:
            vx = np.sqrt(v_square) / np.sqrt(1 + (grad_J(x))**2 )
    x_history = np.append(x_history, x)
# 画出两个函数的图像 并且画出梯度下降的过程
x = np.linspace(-2, 5, 100)
plt.figure(figsize=(8, 6))
plt.plot(x, J(x), label='J(x)')
plt.plot(x_history, J(x_history), 'gx', label='gradient on J')
plt.legend()
plt.xlabel('x')
plt.ylabel('y')
# 显示x轴和y轴
plt.axhline(y=0, color='k')
plt.title('J(x) and grad_J(x)')
plt.ylim(-5, 30)
plt.xlim(-2, 5)
plt.show()
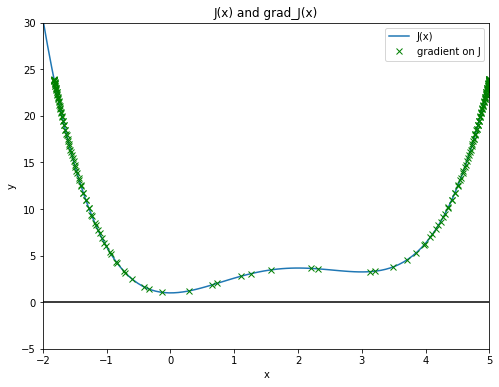
可以看到上图的标记点两边比较密集,而中间比较少,说明两端的速度是比较慢的,而中间区域的速度非常快
# 创建一个动画,将梯度下降的过程可视化,这里使用的是matplotlib的animation模块
from matplotlib import animation
from IPython.display import HTML

fig = plt.figure(figsize=(8, 6))
ax = plt.axes(xlim=(-2, 5), ylim=(-5, 30))
line, = ax.plot([], [], 'bo', lw=2)
line2, = ax.plot([], [], 'r', lw=2)

def init():
    line.set_data([], [])
    line2.set_data([], [])
    return line, line2

def animate(i):
    x = np.linspace(-2, 5, 100)
    y = J(x)
    y2 = grad_J(x)
    line.set_data(x_history[i], J(x_history[i]))
    line2.set_data(x, y)
    return line, line2

anim = animation.FuncAnimation(fig, animate, init_func=init,
                                frames=200, # 这里的frames是指动画的帧数
                                interval=40,  # 这里的interval是指动画的间隔时间 单位是ms
                                blit=True # 这里的blit是指是否只更新动画中改变的部分
                                )

HTML(anim.to_html5_video())
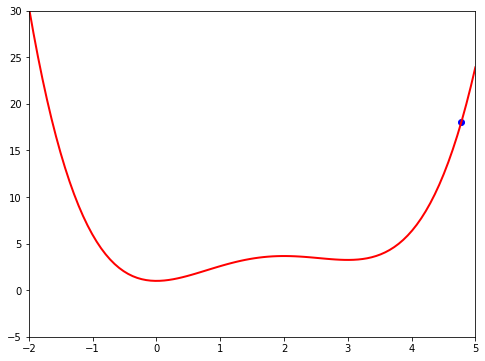
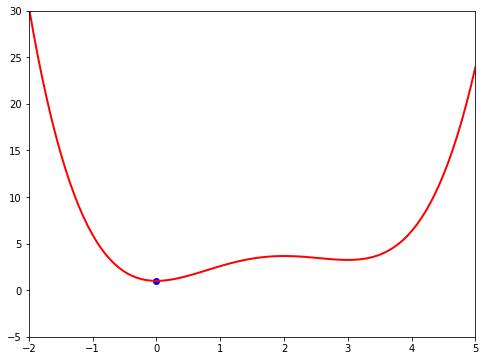
从上面的视频可以看出,由于没有摩擦力的影响,小球就会上升到原来高度的地方(能量守恒)
改进:增加摩擦力
由摩擦力和支持力的关系:
由支持力,重力分量,向心加速度的关系,我们都有下面式子:
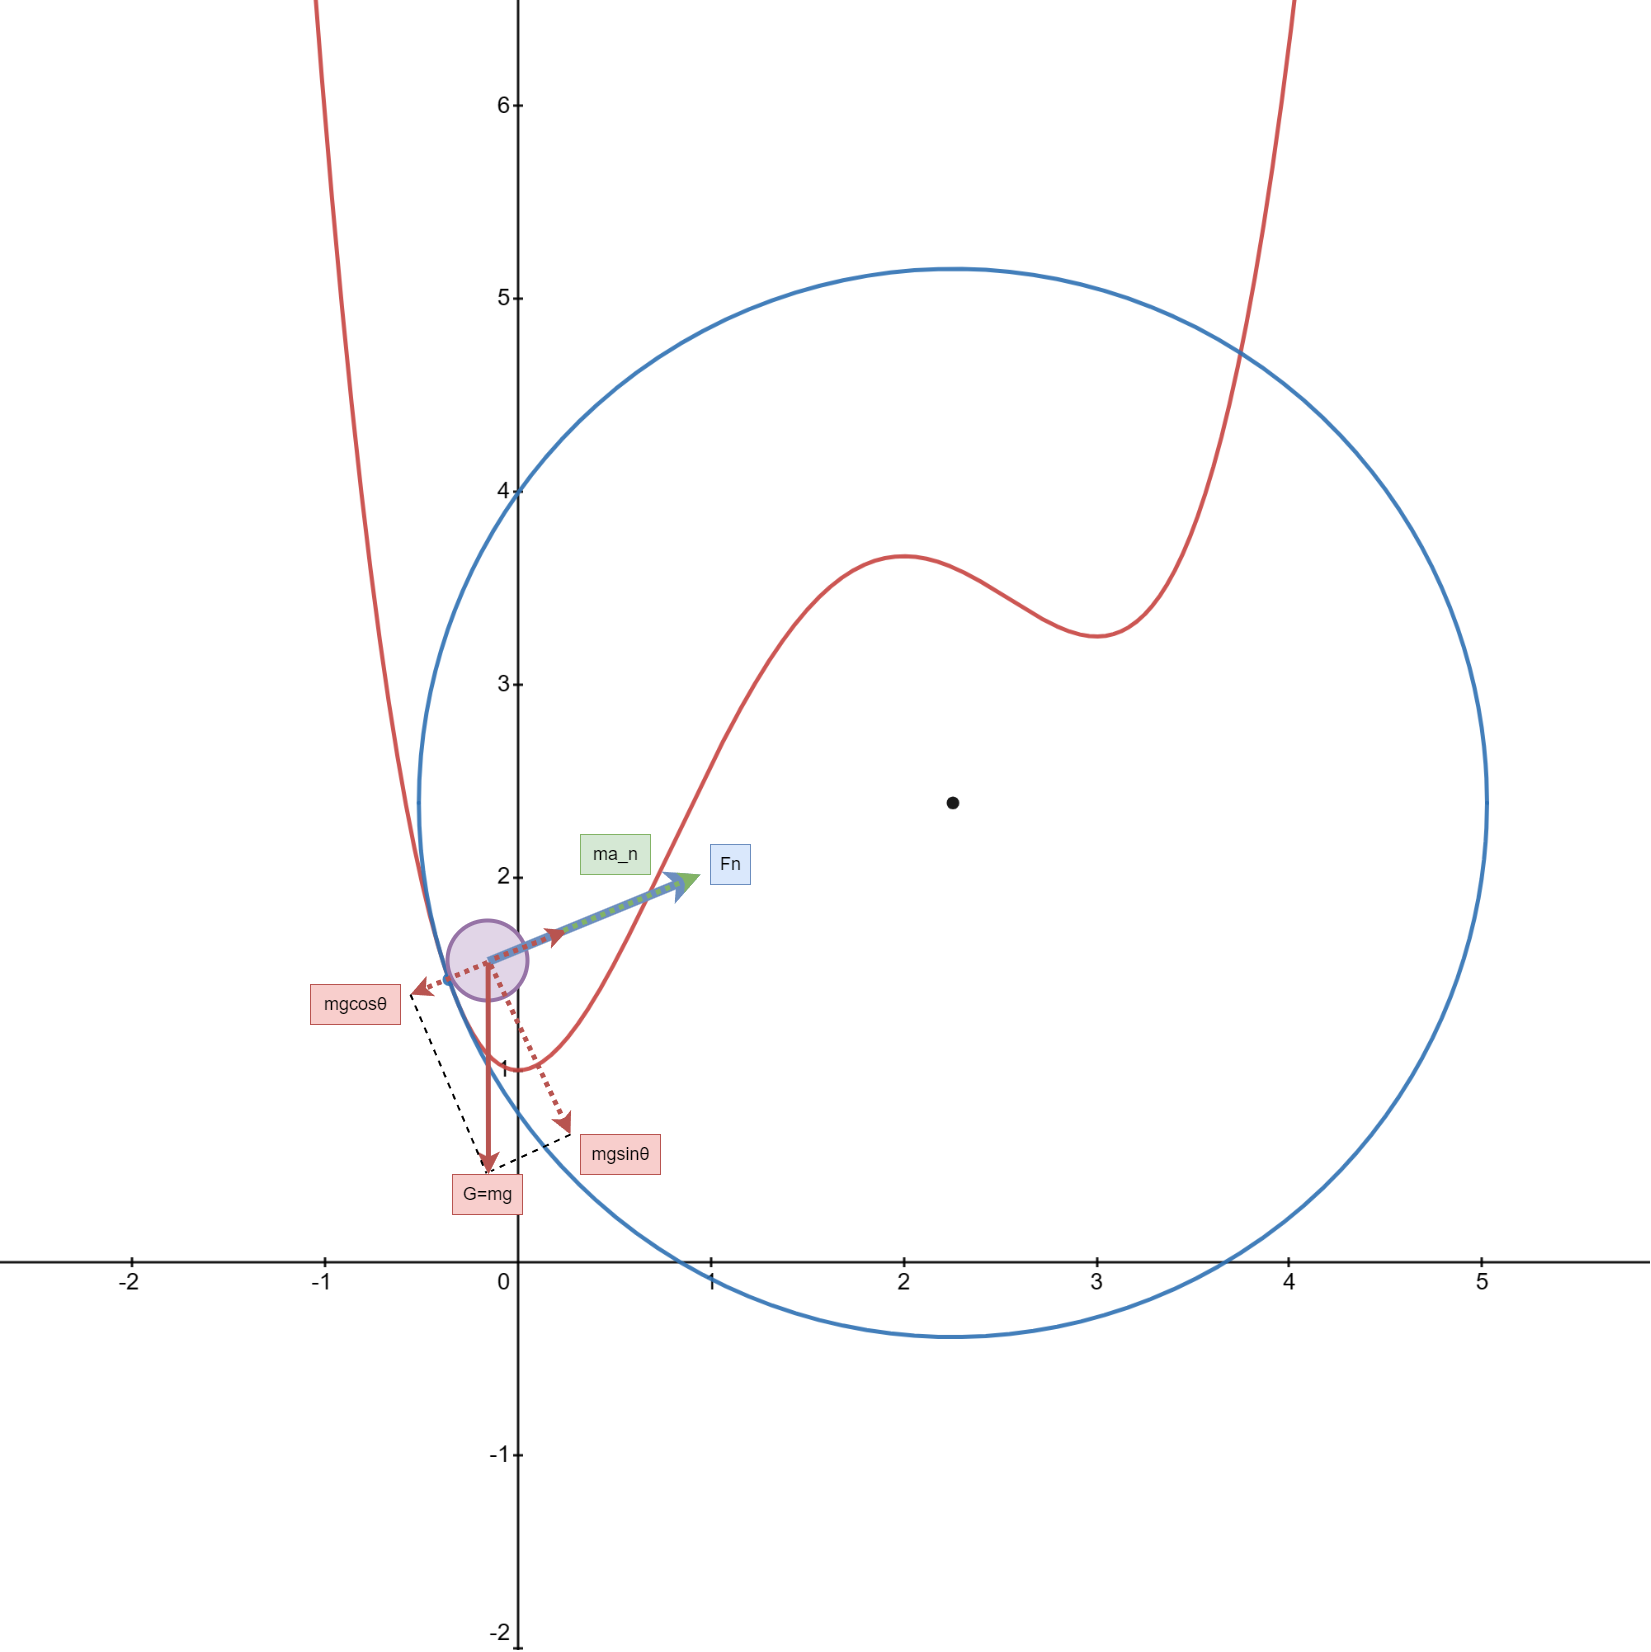
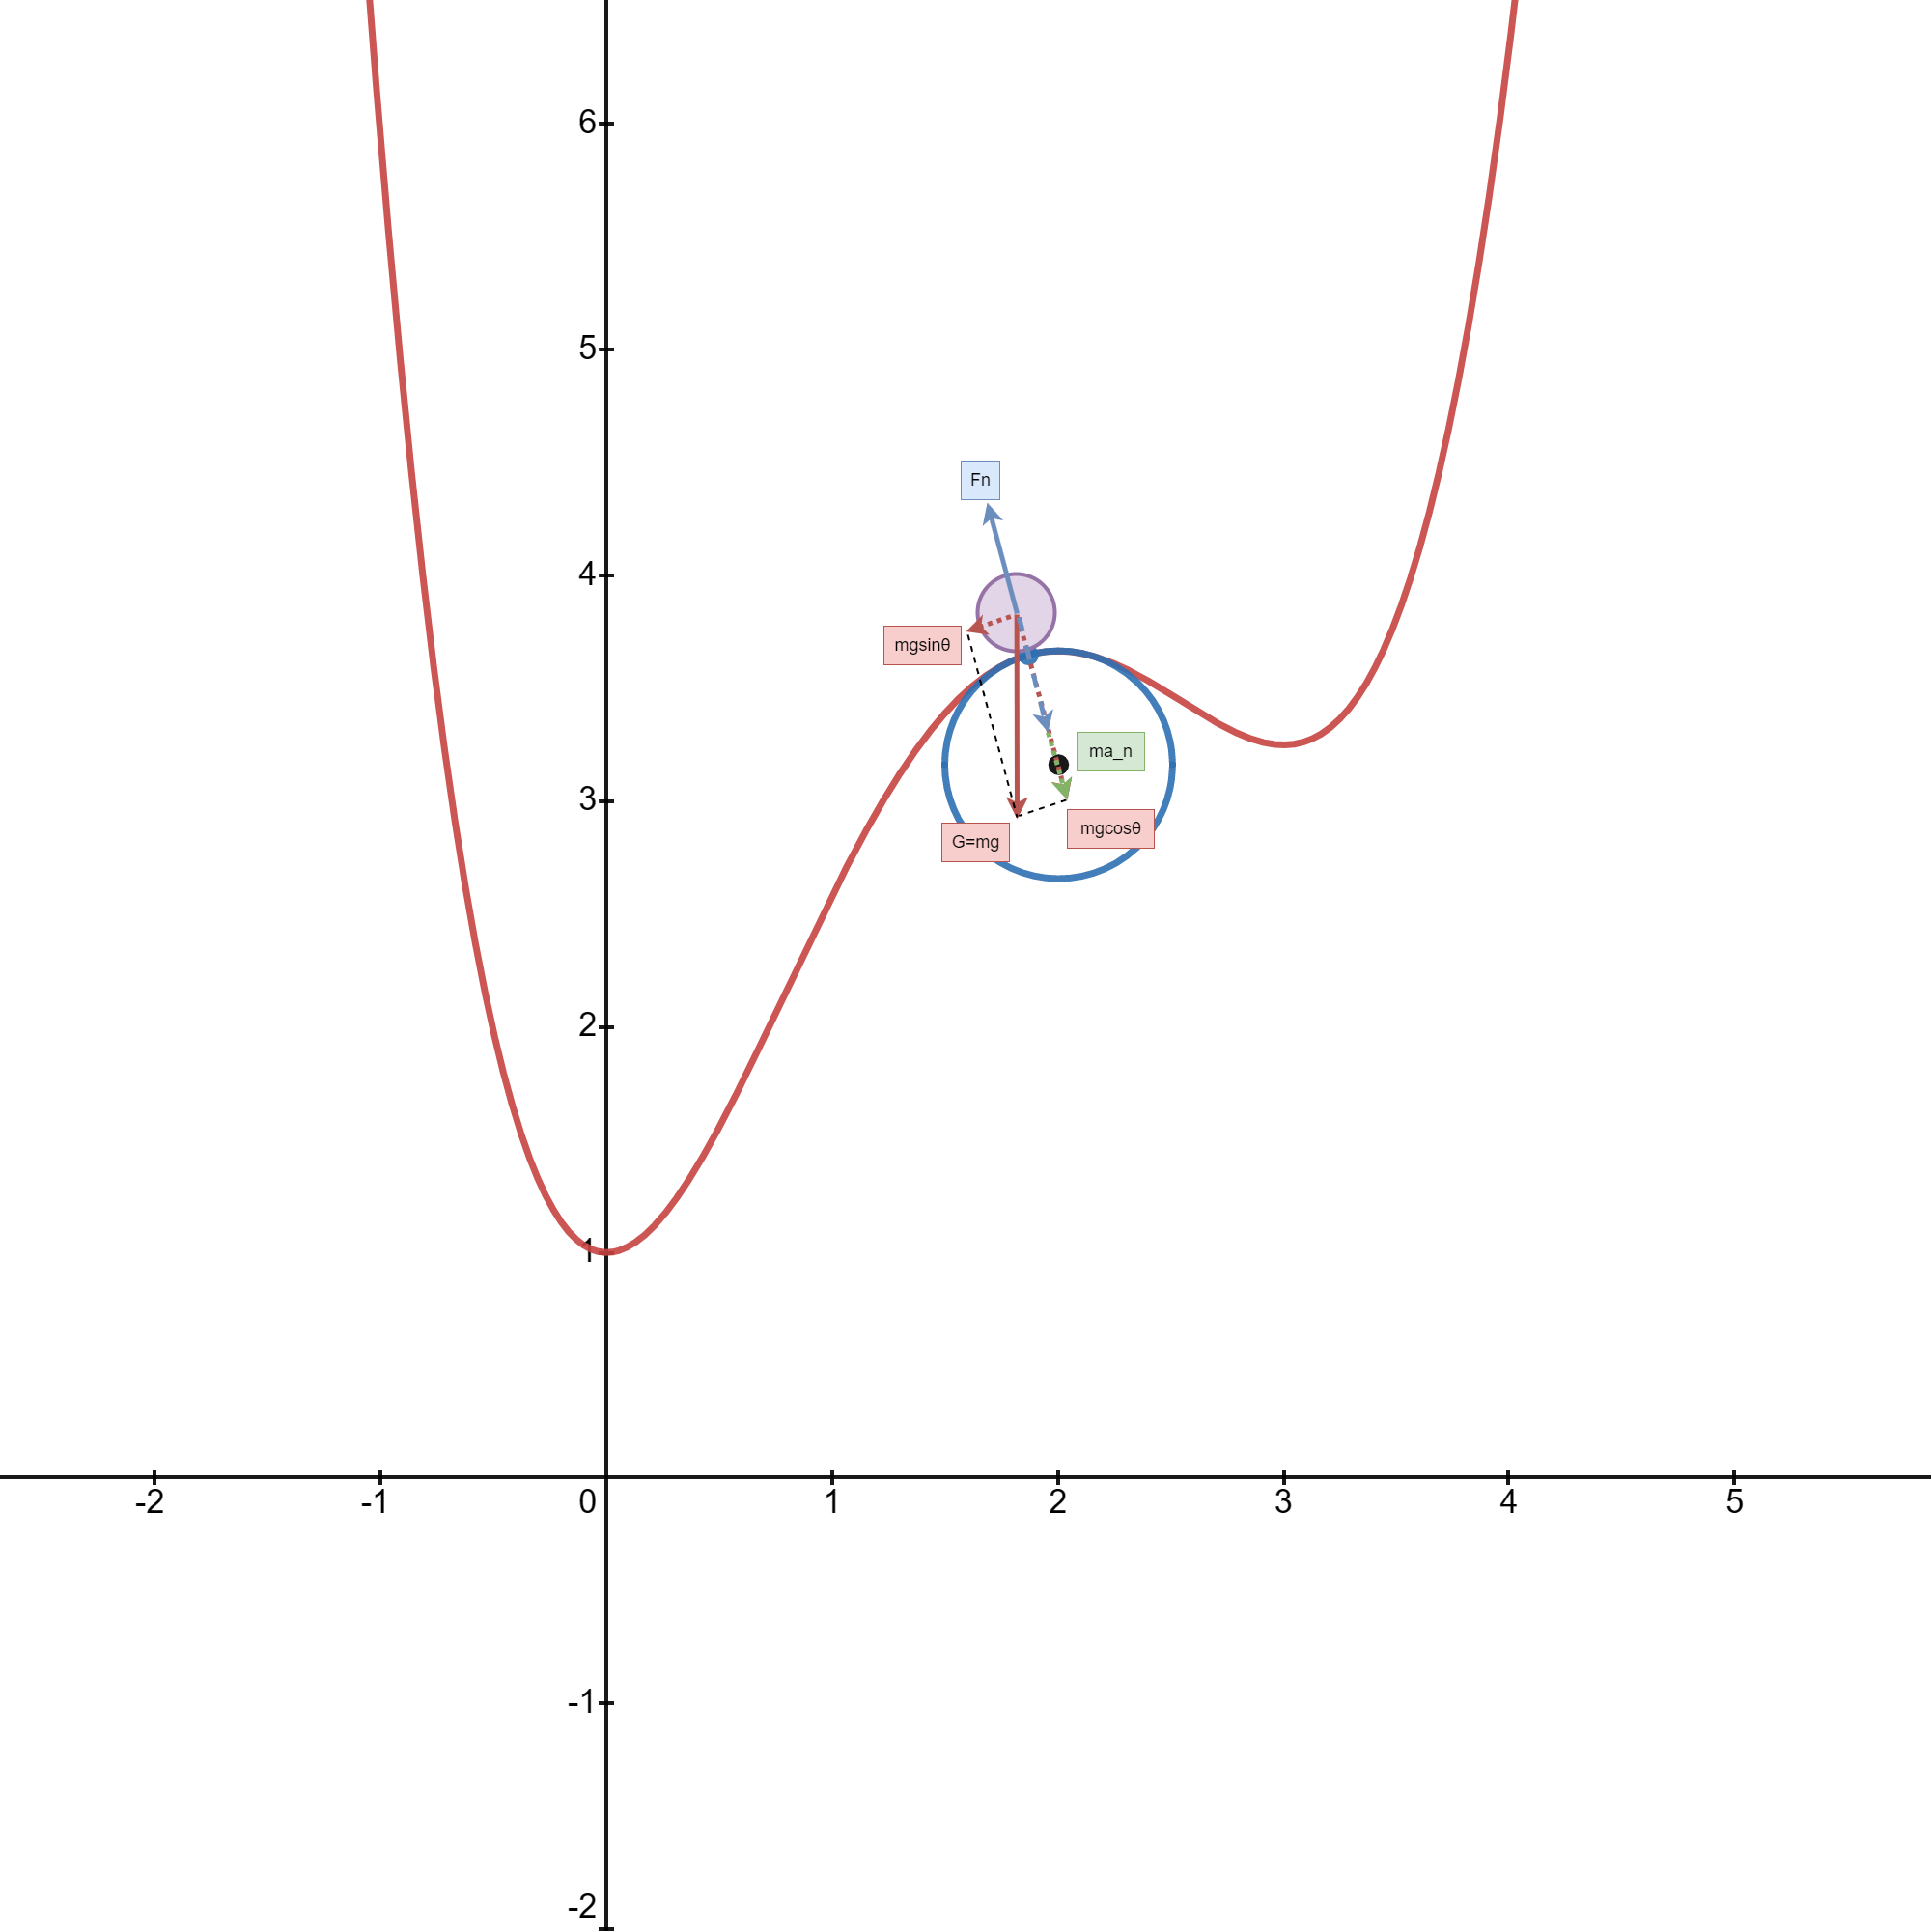
需要注意,为向心加速度,它的值可正可负,需要知道的只有一点,它的方向指向凹的那一边(向心加速度的方法与曲率半径方向一致,都是指向曲率圆的圆心),如下面两幅图(第一幅图向心加速度为正,第二幅图向心加速度为负)
由函数图像我们可以求得一点的曲率半径,求法如下(可以看这个用desmos画的图,这样可以更好理解曲率半径是什么desmos):
我们发现需要用到二阶导,如下
@latexify.function
def gradgrad_J(x):
    return 3 * x**2 - 10 * x + 6

gradgrad_J
由能量守恒,我们只需要再原来的代码上更新v_square的值即可,由能量守恒得
x = 5
v_square = 0
vx = 0
dt = 0.05
g = 15
mu = 0.4
x_history = np.array([x])
for i in range(75):
    # print("该点的水平位置为:", x,end=' ')
    # print("该点的水平速度为:", vx,end=' ')
    # print("该点的动能为:", 0.5 * v_square)
    prex = x
    # update x
    x = x + dt * vx
    v_square = v_square + 2 * g * (J(prex)-J(x)) - 2 * mu * (g + v_square * gradgrad_J(x) / (1 + grad_J(x)**2))*abs(x-prex)
    if v_square <= 0:
        v_square = 0
        vx = g * (-grad_J(x)) / (1 + (grad_J(x))**2) * dt
    else:
        if x - prex < 0:
            vx = -np.sqrt(v_square) / np.sqrt(1 + (grad_J(x))**2 )
        else:
            vx = np.sqrt(v_square) / np.sqrt(1 + (grad_J(x))**2 )
    x_history = np.append(x_history, x)

# 输出x_history的最后一个元素,即为最优解
print(x_history[-1])
-3.134825339048e-05
# 创建一个动画,将梯度下降的过程可视化,这里使用的是matplotlib的animation模块
from matplotlib import animation
from IPython.display import HTML

fig = plt.figure(figsize=(8, 6))
ax = plt.axes(xlim=(-2, 5), ylim=(-5, 30))
line, = ax.plot([], [], 'bo', lw=2)
line2, = ax.plot([], [], 'r', lw=2)

def init():
    line.set_data([], [])
    line2.set_data([], [])
    return line, line2

def animate(i):
    x = np.linspace(-2, 5, 100)
    y = J(x)
    y2 = grad_J(x)
    line.set_data(x_history[i], J(x_history[i]))
    line2.set_data(x, y)
    return line, line2

anim = animation.FuncAnimation(fig, animate, init_func=init,
                                frames=len(x_history), # 这里的frames是指动画的帧数
                                interval=40,  # 这里的interval是指动画的间隔时间 单位是ms
                                blit=True # 这里的blit是指是否只更新动画中改变的部分
                                )

HTML(anim.to_html5_video())
测试与总结
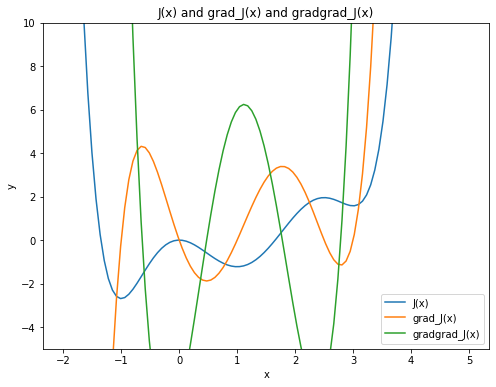
这里我们重新定义J(x)来测试一下不同函数的效果,构造grad_J如下
则J(x)为
代码如下
import numpy as np
import matplotlib.pyplot as plt

def J(x):
    return x**6/6 - 5.5*x**5/5 + 6.5*x**4/4 + 5.5*x**3/3 - 7.5*x**2/2

def grad_J(x):
    return x**5 - 5.5*x**4 + 6.5*x**3 + 5.5*x**2 - 7.5*x

def gradgrad_J(x):
    return 5*x**4 - 22*x**3 + 19.5*x**2 + 11*x - 7.5
# 画出两个函数的图像
x = np.linspace(-2, 5, 100)
plt.figure(figsize=(8, 6))
plt.plot(x, J(x), label='J(x)')
plt.plot(x, grad_J(x), label='grad_J(x)')
plt.plot(x, gradgrad_J(x), label='gradgrad_J(x)')
plt.legend()
plt.xlabel('x')
plt.ylabel('y')
plt.title('J(x) and grad_J(x) and gradgrad_J(x)')
plt.ylim(-5, 10)
plt.show()
def physisc_grad_descent(grad_J, gradgrad_J, x0=4, dt = 0.05, g = 9.8, mu = 0.1, n_iters=75, is_print=False):
    x = x0
    v_square = 0
    vx = 0
    x_history = np.array([x])
    for i in range(n_iters):
        if is_print:
            print("该点的水平位置为:", x,end=' ')
            print("该点的水平速度为:", vx,end=' ')
            print("该点的动能为:", 0.5 * v_square)
        prex = x
        # update x
        x = x + dt * vx
        v_square = v_square + 2 * g * (J(prex)-J(x)) - 2 * mu * (g + v_square * gradgrad_J(x) / (1 + grad_J(x)**2))*abs(x-prex)
        if v_square <= 0:
            v_square = 0
            vx = g * (-grad_J(x)) / (1 + (grad_J(x))**2) * dt
        else:
            if x - prex < 0:
                vx = -np.sqrt(v_square) / np.sqrt(1 + (grad_J(x))**2 )
            else:
                vx = np.sqrt(v_square) / np.sqrt(1 + (grad_J(x))**2 )
        x_history = np.append(x_history, x)
    return x_history
# 创建一个动画,将梯度下降的过程可视化,这里使用的是matplotlib的animation模块
from matplotlib import animation
from IPython.display import HTML

fig = plt.figure(figsize=(8, 6))
ax = plt.axes(xlim=(-2, 5), ylim=(-5, 30))
line, = ax.plot([], [], 'bo', lw=2)
line2, = ax.plot([], [], 'r', lw=2)

def init():
    line.set_data([], [])
    line2.set_data([], [])
    return line, line2

def animate(i):
    x = np.linspace(-2, 5, 100)
    y = J(x)
    y2 = grad_J(x)
    line.set_data(x_history[i], J(x_history[i]))
    line2.set_data(x, y)
    return line, line2
x_history = physisc_grad_descent(grad_J, gradgrad_J, x0=4, dt = 0.05, g = 9.8, mu = 0.2, n_iters=150, is_print=False)
# 输出x_history的最后一个元素,即为最优解
print(x_history[-1])
-0.9999999939178434
anim = animation.FuncAnimation(fig, animate, init_func=init,
                                frames=len(x_history), # 这里的frames是指动画的帧数
                                interval=40,  # 这里的interval是指动画的间隔时间 单位是ms
                                blit=True # 这里的blit是指是否只更新动画中改变的部分
                                )

HTML(anim.to_html5_video())
def momentum_grad_descent(grad_J, x0=4, n_iters=75,alpha = 0.1, beta = -0.74,is_print=False):
    prex = x0
    x = prex - alpha * grad_J(prex)
    x_history = np.array([x0,x])
    for i in range(n_iters):
        if is_print:
            print("该点的水平位置为:", x)
        tmp = x
        x = x - alpha * grad_J(x) - beta * (x - prex) # 这里引入了动量的概念
        prex = tmp
        x_history = np.append(x_history, x)
    return x_history
x_history = momentum_grad_descent(grad_J, x0=4, n_iters=100,alpha = 0.05, beta = 0,is_print=False)
# 输出x_history的最后一个元素,即为最优解
print(x_history[-1])
-1.0
anim = animation.FuncAnimation(fig, animate, init_func=init,
                                frames=len(x_history), # 这里的frames是指动画的帧数
                                interval=40,  # 这里的interval是指动画的间隔时间 单位是ms
                                blit=True # 这里的blit是指是否只更新动画中改变的部分
                                )

HTML(anim.to_html5_video())
对比一下动量法和物理梯度下降法的效果
个人感觉这个动画效果还是不错的,可以看出梯度下降的过程,以及动量的概念,以及这个动画是直接html写的,不需要额外的库,可以直接在看到效果,真的非常赞
- 动量法:调参很讲究运气或者说所谓的技巧,不过自己没有领悟到什么技巧,只能是有耐心的慢慢调;
- 物理梯度下降法:这个方法是自己花了两天的时间写出来的,这个调参还是很舒服的,因为每个参数都有其实在的物理意义,而我们只是想办法把小球弄到最底下而已,从这个角度而言物理梯度下降法更直观,而且我们也可以更快地收敛到全局最小值而不用担心太多的调参技巧,实在是非常的cool!!!


【推荐】国内首个AI IDE,深度理解中文开发场景,立即下载体验Trae
【推荐】编程新体验,更懂你的AI,立即体验豆包MarsCode编程助手
【推荐】抖音旗下AI助手豆包,你的智能百科全书,全免费不限次数
【推荐】轻量又高性能的 SSH 工具 IShell:AI 加持,快人一步
· winform 绘制太阳,地球,月球 运作规律
· 震惊!C++程序真的从main开始吗?99%的程序员都答错了
· AI与.NET技术实操系列(五):向量存储与相似性搜索在 .NET 中的实现
· 【硬核科普】Trae如何「偷看」你的代码?零基础破解AI编程运行原理
· 超详细:普通电脑也行Windows部署deepseek R1训练数据并当服务器共享给他人
2022-01-25 开了博客第一件事搞博皮先