PyTorch 深度学习实践 第3讲:梯度下降与随机梯度下降
1.梯度下降(Gradient Descent Algorithm)
代码说明:
1.求损失函数(训练集mse/abs随机样本)
2.and求梯度函数
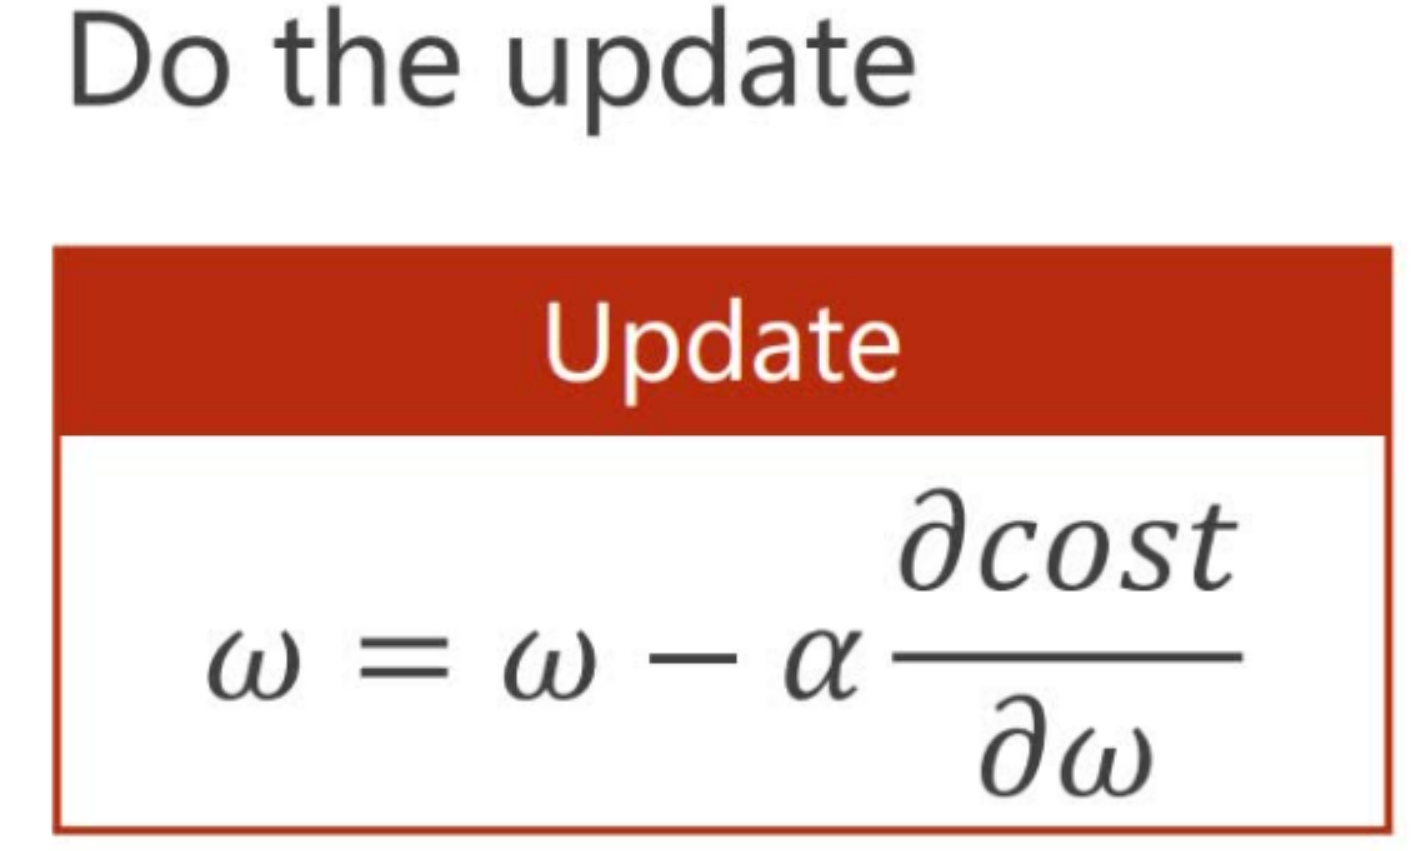
3.梯度下降公式w = w -学习率 * 梯度函数``
import matplotlib.pyplot as plt
#准备数据
x_data = [1.0, 2.0, 3.0]
y_data = [2.0, 4.0, 6.0]
#猜测任意权重
w = 1
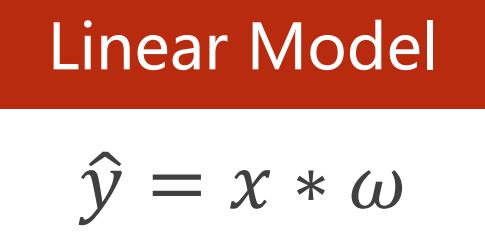
#定义线性函数:y_pred = x * w
def forward(x):
return w * x
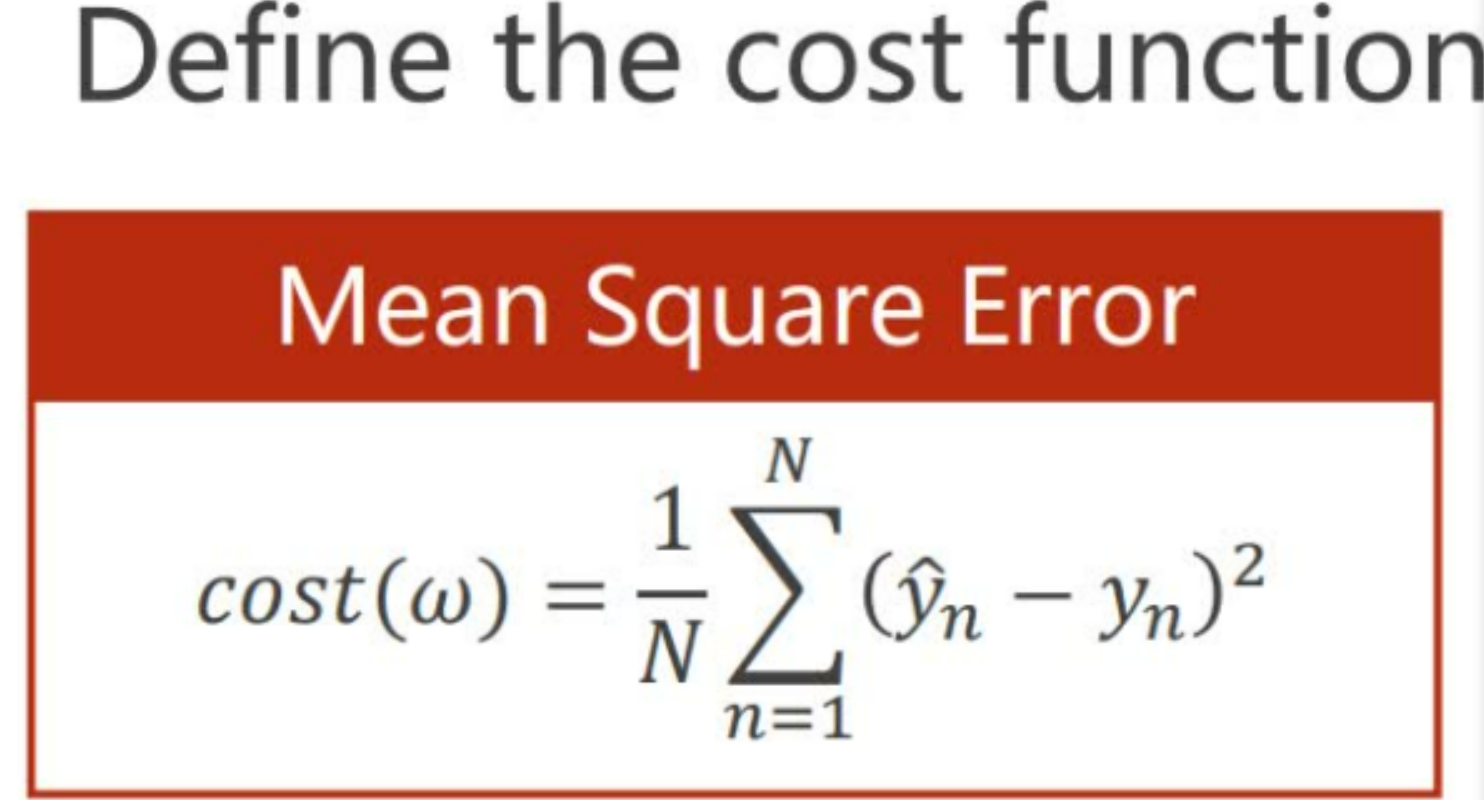
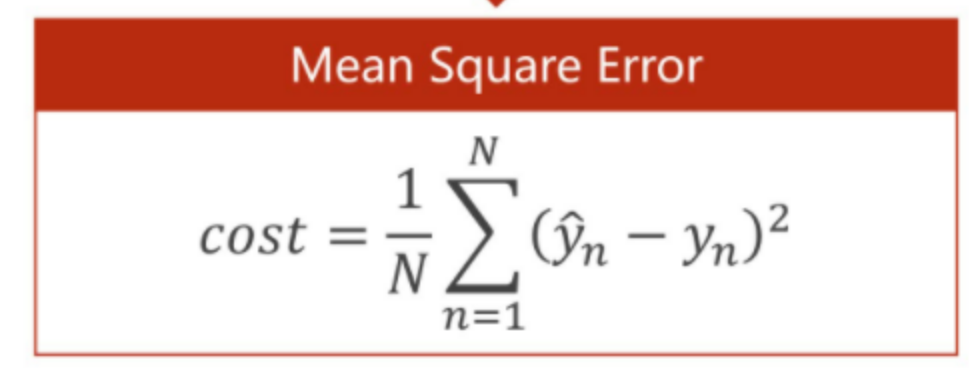
#定义cost func  :计算MSE:mean square error的目标函数
def cost (xs, ys):
    cost = 0
    for x, y in zip(xs, ys):#xs,ys是指x_data,y_data所有的数据
        y_pred = forward(x)
        cost +=(y_pred - y) ** 2#平方求和公式
    return cost/len(xs)#计算平均
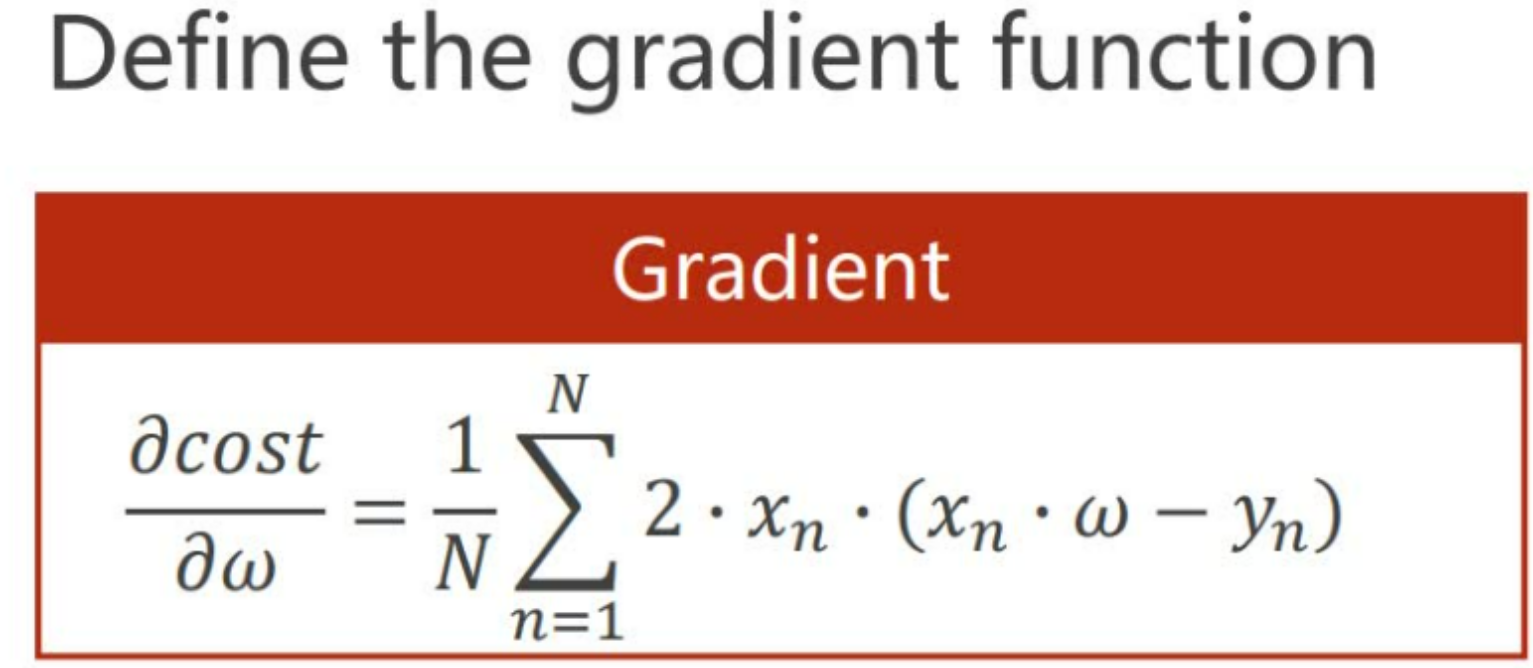
#计算梯度公式:对MSE求w的导数
def gredient(xs, ys):
    grad = 0
    for x ,y in zip(xs,ys):
        grad += 2 * x * (x * w - y)
    return grad /len(xs)
#新建列表用来存储产生数据
epoch_list = []
cost_list = []

print('predict(before training)', 4, forward(4))
#训练过程:1计算mse,2计算mse对w的导数,3计算梯度下降公式
for epoch in range(100):
    cost_val = cost(x_data, y_data)
    grad_val = gredient(x_data, y_data )
    w-= 0.01 * grad_val#0.01是学习率,梯度下降
    print ('epoch:', epoch, 'w=', w,'1oss = ',cost_val)
    epoch_list.append(epoch)
    cost_list.append(cost_val)
print('predict (after training)', 4, forward(4))
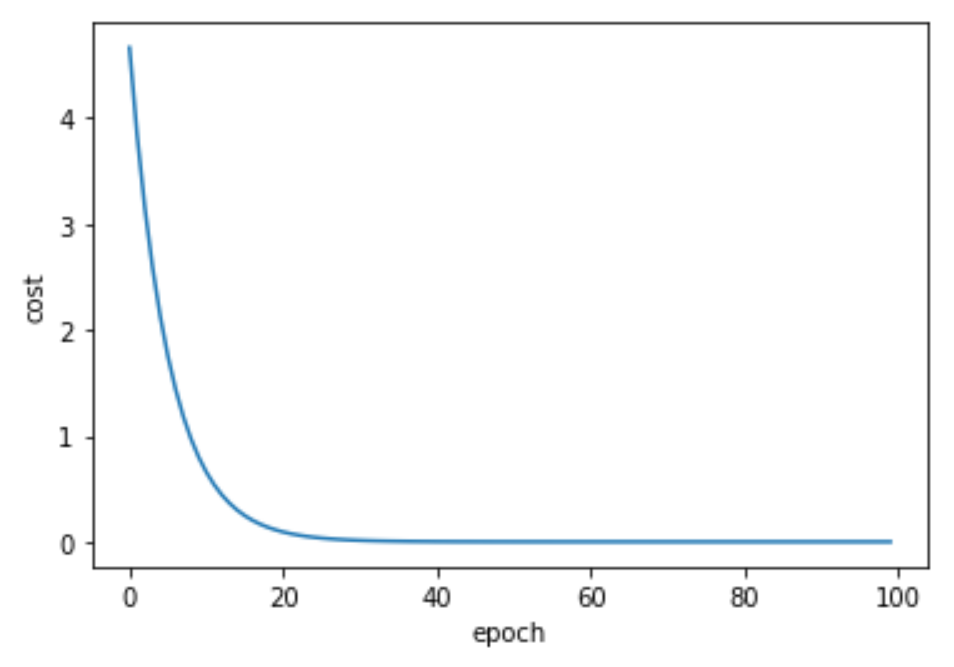
plt.plot(epoch_list,cost_list)
plt.ylabel('cost')
plt.xlabel('epoch')
plt.show
补充知识点:
1.cost function是什么?
代价函数(cost function)是定义在整个训练集上的,是所有误差的平均,也就是损失函数的平均,我们要做的是不断优化神经网络来减少代价函数的值(最优代价函数)
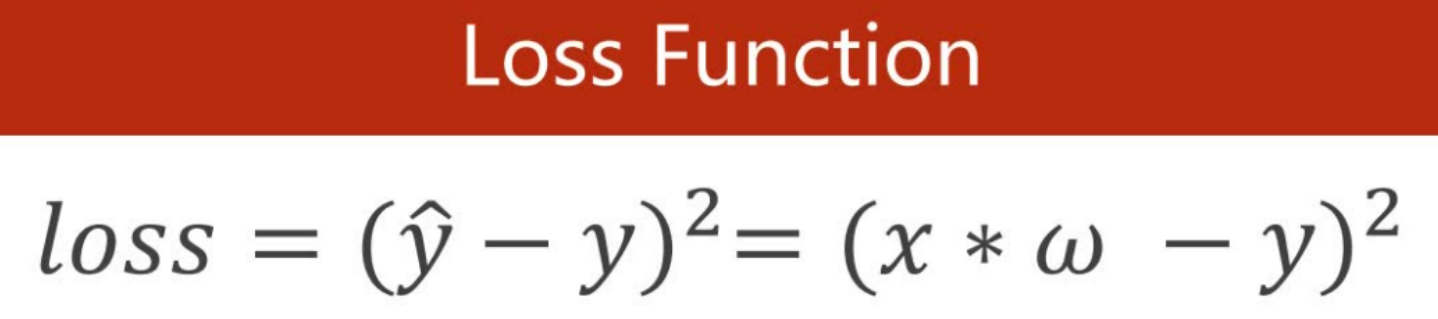
而损失函数(Loss Function)是定义在单个样本上的,算是一个样本的误差
2.什么是MSE?
数理统计中均方误差是指参数估计值与参数真值之差平方的期望值,记为MSE。MSE是衡量“平均误差”的一种较方便的方法,MSE可以评价数据的变化程度,MSE的值越小,说明预测模型描述实验数据具有更好的精确度。
2. 随机梯度下降(Stochastic Gradient Descent)2. 随机梯度下降(Stochastic Gradient Descent)
随机梯度下降法和梯度下降法的主要区别在于:
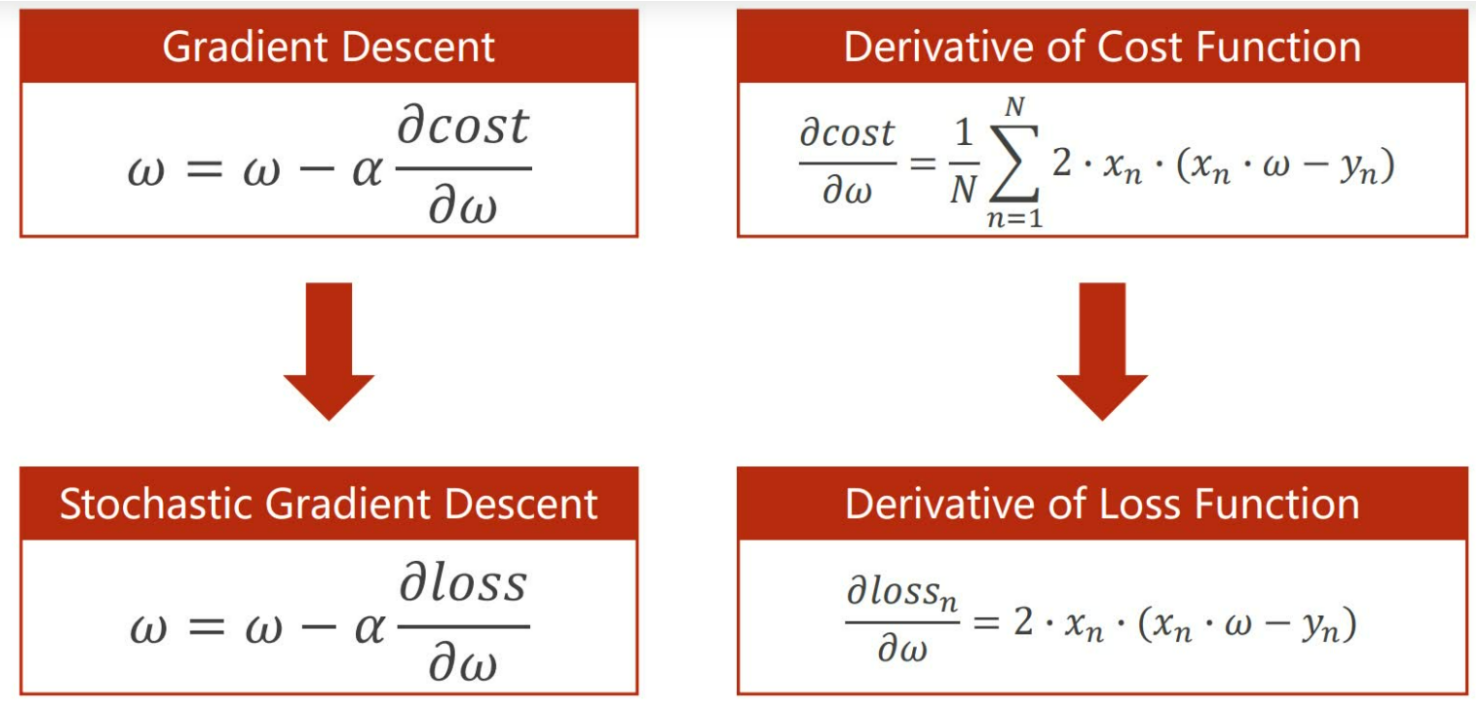
1.损失函数由cost()更改为loss(),cost是所有数据的损失,loss() 是单一样本的损失
2.gradient()由计算所有训练数据的梯度更改为计算一个训练数据的梯度
3.本算法中的随机梯度主要是指,每次拿一个训练数据来训练,然后更新梯度参数。本算法中梯度总共更新100(epoch)x3 = 300次。梯度下降法中梯度总共更新100(epoch)次。
import matplotlib.pyplot as plt
#准备数据
x_data = [1.0, 2.0, 3.0]
y_data = [2.0, 4.0, 6.0]
w = 1.0
#定义线性模式y的预测值:
def forward(x):
return w * x
#计算损失函数(loss function)
def loss(x,y):
y_pred = forward(x)
return(y_pred - y) ** 2
#计算梯度函数 gradient function sgd
def gradient(x,y):
return 2 * x * (x * w -y)
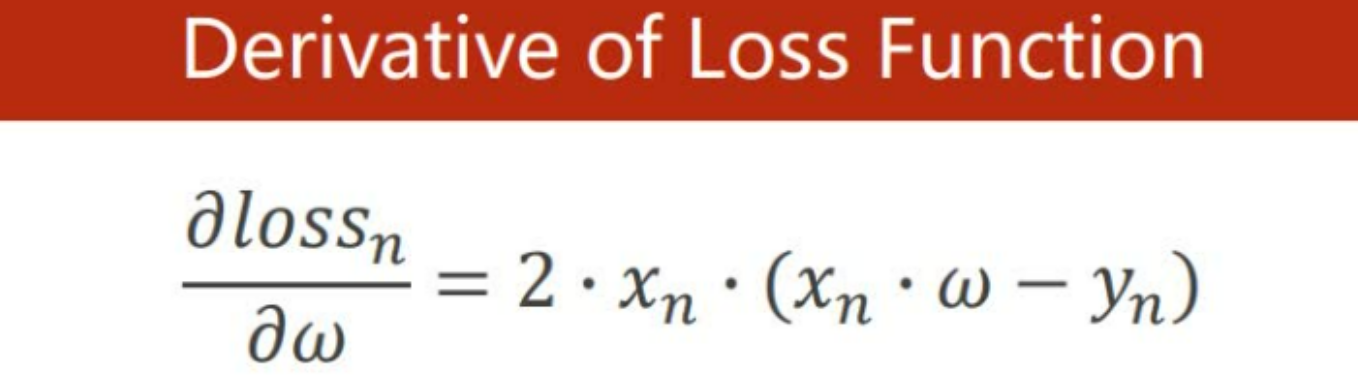
#损失函数的导数,derivative of loss function
公式:
epoch_list = []
loss_list = []
print('predict(before training)',4, forward(4))
#Update weight by every grad of sample of train set.
#更新每个梯度一系列样本的权重,训练过程
for epoch in range(100):
    for x, y in zip(x_data,y_data):
        grad = gradient(x,y)
        w = w - 0.01 * grad # # update weight by every grad of sample of training set
        print("\tgrad:",x,y,grad)
        l = loss(x,y)
        print("progress:",epoch,"loss = ",l)
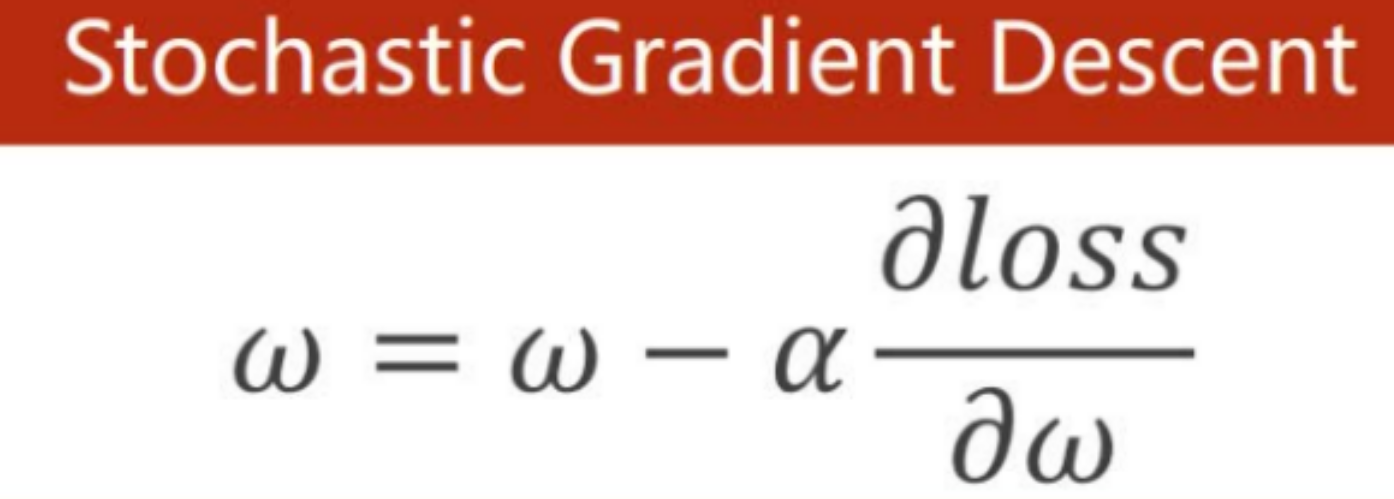
随机梯度下降公式:
epoch_list.append(epoch)
loss_list.append(l)

print('predict(after training)',4, forward(4))
plt.plot(epoch_list,loss_list)
plt.ylabel('loss')
plt.xlabel('epoch')
plt.show()

 浙公网安备 33010602011771号