【vue+ECharts】在 webpack 中使用 ECharts
在 webpack 中使用 ECharts 【官网教程】
1、使用如下命令通过 npm 安装 ECharts
npm install echarts --save
2、全局引用在main.js
import echarts from 'echarts'
Vue.prototype.$echarts = echarts;
3、运用
<div style="width:60vw;height:280px;" ref="chart"></div>
<script>
export default {
    name: 'Echarts',
    data() {
        return  {
            option : {
                color:['#3398DB'],
                title: {
                    text: '同比数据分析',
                    subtext: '数据分析'
                },
                tooltip: {},
                legend: {
                    data:['电力']
                },
                xAxis: {
                    name: '月',
                    data: ["1","2","3","4","5","6","7","8","9","10","11","12"]
                },
                yAxis: {},
                series: [{
                    name: 'kW·h',
                    type: 'bar',
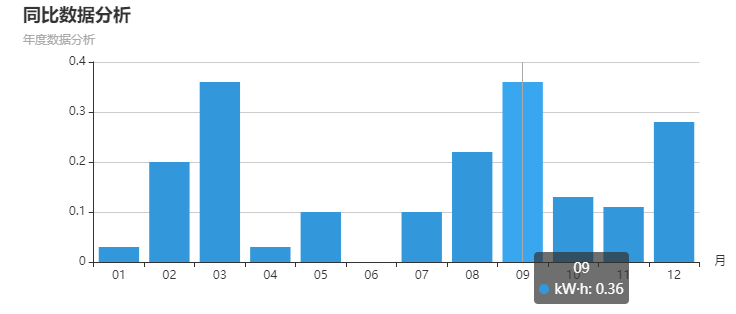
                    data: [0.03, 0.2, 0.36, 0.03, 0.1, 0, 0.1, 0.22, 0.36, 0.13, 0.11, 0.28]
                }]
            }
        }
    },
    mounted(){
        this.initCharts()
    },
    methods: {
        initCharts(){
            this.option.title.text= "环比分析"
            let myChart = this.$echarts.init(this.$refs.chart);
           myChart.setOption(this.option);
            window.addEventListener("resize",function(){myChart.resize();});
        },
    },
}
</script>
现在可以成功显示了:

5、遇到的报错以及解决
| Error in created hook: "TypeError: Cannot read property 'getAttribute' of undefined" |
|
原因:echarts的初始化写到了created的回调函数中(模板渲染成HTML前调用,即通常初始化某些属性值,然后再渲染) |
echarts图标不随页面缩放 在setOption(xxx)之后写: |
| 1>(单页单图表)window.onresize = myChart.resize; 2>(单页多图表)window.addEventListener(“resize”,function(){myChart.resize(); }); myChart指自己定义的echartsDom对象 |


