
时间序列、时序TimeSeriesSplit&GridGridSearchCV,超参数优化参考
此外,可看看这个:
https://blog.csdn.net/qq_35649669/article/details/104793484
https://www.cnblogs.com/Li-JT/p/16792521.html
#链接:https://www.zhihu.com/question/316884123/answer/2271867939
# -*- coding: utf-8 -*-
# @Time : 2021/12/21 13:42
# @Author : Orange
# @File : test.py.py
from xgboost import XGBRegressor
from sklearn.model_selection import GridSearchCV, TimeSeriesSplit
import numpy as np
import matplotlib.pyplot as plt
# 以xgboost为例,给出时间序列的GridSearchCV结合TimeSeriesSplit的调参
def train(x_train, y_train):
my_cv = TimeSeriesSplit(n_splits=4).split(x_train)
cv_params = {'n_estimators': [6, 7, 8, 10, 20], 'learning_rate': [0.01, 0.1, 0.3,0.9,1], 'max_depth': [4, 5, 6, 7, 8],
'min_child_weight': [4, 5, 6, 7, 8], 'gamma': [1, 3], 'reg_alpha': [0.1, 0.3]}
other_params = {'learning_rate': 0.1, 'n_estimators': 90, 'max_depth': 7, 'min_child_weight': 4, 'seed': 0,
'subsample': 1, 'colsample_bytree': 0.9, 'gamma': 1, 'reg_alpha': 0.1, "lambda": 0.9}
model = XGBRegressor(**other_params)
optimized_GBM = GridSearchCV(estimator=model, param_grid=cv_params, scoring='neg_mean_absolute_error', cv=my_cv)
optimized_GBM.fit(np.array(x_train), np.array(y_train))
model = optimized_GBM.best_estimator_
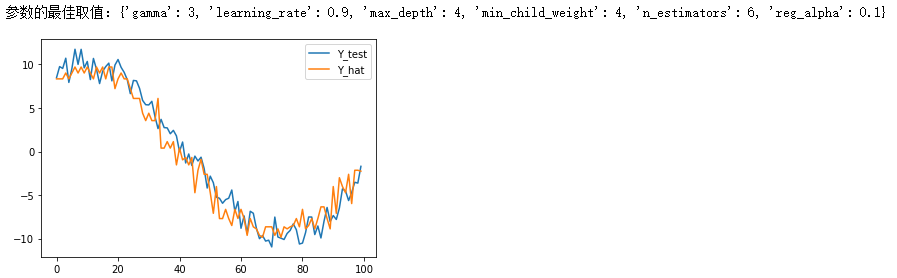
print('参数的最佳取值:{0}'.format(optimized_GBM.best_params_))
return model
if __name__ == '__main__':
data = np.sin(np.arange(0, 1000) * 0.05) * 10 + np.random.randn(1000)
# 取当前时间为第500个数据所在的时刻
# 特征取前500个数据,利用前500个数据预测后500个数据
X = data[:500].reshape(500, 1)
Y = data[500:]
X_train = X[:400]
X_test = X[400:]
Y_train = Y[:400]
Y_test = Y[400:]
model = train(X_train, Y_train)
Y_hat = model.predict(X_test)
plt.figure()
plt.plot(Y_test)
plt.plot(Y_hat)
plt.legend(['Y_test', 'Y_hat'])
plt.show()
import numpy as np
import pandas as pd
import matplotlib.pyplot as plt

data = np.sin(np.arange(0, 1000) * 0.05) * 10 + np.random.randn(1000)
print(data.shape)#shape为:(1000,);

# 取当前时间为第500个数据所在的时刻
# 特征取前500个数据,利用前500个数据预测后500个数据
X = data[:500]
Y = data[500:]
print(X[:5])
X_train = X[:400]
X_test = X[400:]
Y_train = Y[:400]
Y_test = Y[400:]
#输出:
(1000,)
[-0.30297777  0.12789509  0.86609582  1.01907432  1.14387907]


 浙公网安备 33010602011771号