Python中plt.plot()、plt.scatter()和plt.legend函数的用法示例
参考:http://www.cppcns.com/jiaoben/python/471948.html
https://blog.csdn.net/weixin_44825185/article/details/105688701
https://blog.csdn.net/qq_43186282/article/details/121513266

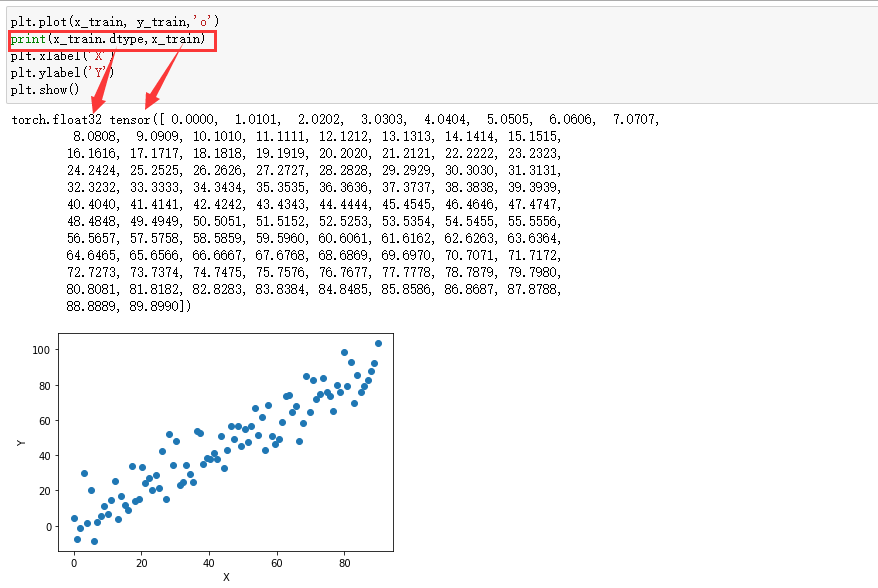
tensor确实在pytorch新版本中可以直接plot画图了。
对于requires_grad=False的张量,可以直接将张量作为plot()的输入
x_data = torch.linspace(-math.pi, math.pi, 2000, dtype=dtype, device=device)
y_data = torch.sin(x_data)

plt.plot(x_data, y_data)
plt.show()
对于requires_grad=True的张量,必须使用张量的data作为plot的输入,主要原因可能是因为原张量如果被设置为requires_grad=True,原张量中会包含data和grad两个数据,从而plot不知道使用哪个进行绘图,所以要指定出来是.data;否则会提示如下错误语句:
RuntimeError: Can't call numpy() on Tensor that requires grad. Use tensor.detach().numpy() instead.
x_data = torch.linspace(-math.pi, math.pi, 2000, dtype=dtype, device=device, requires_grad=True)
y_data = torch.sin(x_data)

plt.plot(x_data.data, y_data.data)
plt.show()
此外也可看看:https://zhuanlan.zhihu.com/p/427317195


 浙公网安备 33010602011771号