Python笔记12-----画图Matplotlib
1、matplotlib:pyplot和pylab
如:
import pylab as pl
pl.figure(figsize=(8,6),dpi=100)【建立的图像大小和图的精度】
pl.plot(x,y,label='Line1')
pl.plot(x,y,label='Line2')
pl.legend(loc='upper left') #将图标放于左上角
#pl.legend(loc='best') #将图标自动放于最好的位置
import matplotlib.pyplot as plt
plt.plot(x,y)
- plt.title('****'):图的名字
- plt.xlabel('***')
- plt.ylabel('***'):将y标签设置为***
- plt.legend(loc='upper left')
- plt.xticks(rotation=45):或者rotation='vertical'将x轴坐标偏斜45度写。https://www.cnblogs.com/laumians-notes/p/8185315.html
- plt.set_ylim(0,50):将y轴的区间设置为0到50
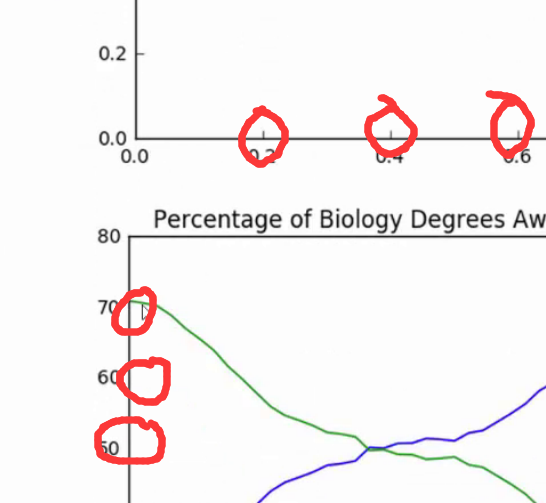
- plt.tick_params(bottom='off',top='off',left='off',right='off'):就是如下图所示,将圈圈中的去掉。
fig=plt.figure()
ax=fig.plot()
for key,spine in ax.spines .items():
- spine.set_visible(False) #将所有轴的横线去掉,如下图

- ax.text(x,y,‘文本’):在x,y处添加文本。
plt.show()
2、图的类型
色彩样式:
1、折线图:plot(x,y)
plot(x,y,'r--')【红色虚线,用单个字符来表示】
plot(x,y,color='red',linestyle=……,linewidth=10)
plot的其他属性:plot(x,y,color='green',marker='*',linewidth=3,label='Line1')
2、散点图:scatter(x,y)
3、柱状图:bar(x,y,0.3):将柱的宽度设置为0.3
barh(x,y,0.5):将柱横过来画,宽度为0.5
4、柱形图:hist(x,y,range(4,5),bins=20):柱形图的横坐标有个范围为bins=20个,如要画0-20,20-40,40-60,这种区间的柱形图可用hist,range(4,5)表示只画区间中的第4个范围。
5、箱型图:boxplot(数据):数据可以为一个列表【数据A,数据B】,在一个图中将A和B的箱型图一起画出来
多子图:
import matplotlib.pyplot as plt
方式1:plt.subplot(211)#第一个参数和第二个参数表示行和列数,第三个参数表示所在区域的编号
方式2:plt.axes([left,bottom,width,height])#第一个参数表示距离左边界的距离,第二个参数表示距离底边的距离(按坐标轴百分比计算),后面两个参数就是这张图的宽度和高度。
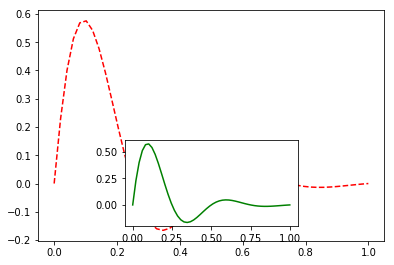 |
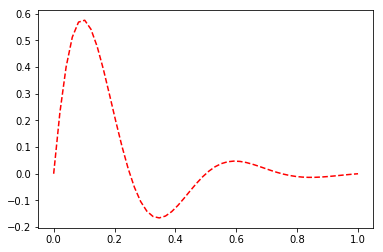
import numpy as np import matplotlib.pyplot as plt x = np.linspace(0, 1) y = np.sin(4 * np.pi * x) * np.exp(-5 * x) plt.axes([0.1,0.1,0.8,0.8]) plt.plot(x, y,'r--') plt.axes([0.3,0.15,0.4,0.3]) plt.plot(x,y,'g*') |
import matplotlib.pyplot as plt
fig=plt.figure(figsize=(3,6)):给大图添加大小
ax1=fig.add_subplot(2,3,1):添加一个子图,一个2行3列区域的大图,ax1图在第1个子图域处。
ax6=fig.add_subplot(2,3,6):添加一个子图,一个2行3列区域的大图,ax6图在第6个子图域处。
ax1.plot(x,y)
ax6.plot(x,y)
plt.show()

 浙公网安备 33010602011771号