# 导入相关包
import tensorflow as tf
import numpy as np
import pandas as pd
import matplotlib.pyplot as plt
%matplotlib inline
# 读取数据
data = pd.read_csv('./datas/Income1.csv')
# 准备 x,y轴数据
x = data.Education
y = data.Income
# 绘制散点图
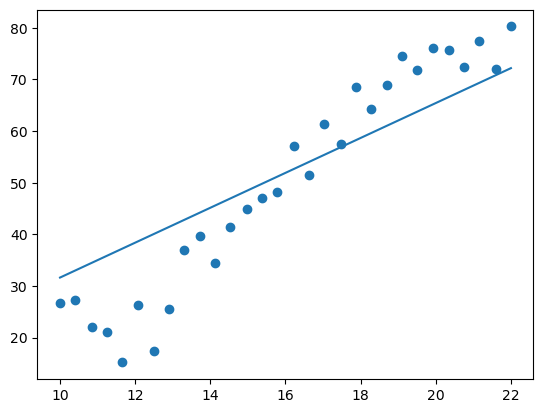
plt.scatter(x,y)

# 搭建线性回归网络
model = tf.keras.Sequential(
tf.keras.layers.Dense(1,input_shape=(1,))
)
# model.summary()
model.compile(optimizer="adam",loss="mse")
# 开始训练 并 记录 训练过程
history = model.fit(x,y,epochs=10000)
Epoch 10000/10000
1/1 [==============================] - 0s 997us/step - loss: 96.1694
# 预测结果
pre_data = model.predict(x)

# 将预测结果和实际数据进行对比
plt.plot(x,pre_data.reshape((30,)).tolist())
plt.scatter(x,y)

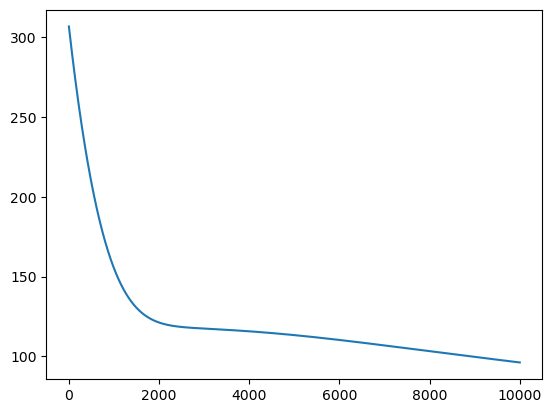
# 绘制10000次训练过程中的损失率
plt.plot(history.history.get('loss'))


 浙公网安备 33010602011771号