

Echart--基本属性
效果图:
设置数据:
var option = {
title: {
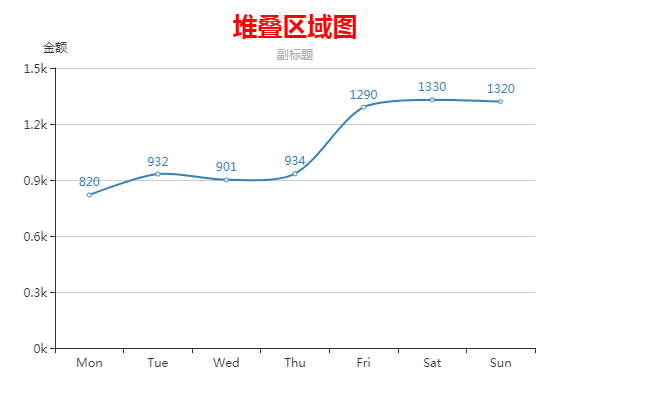
text: '堆叠区域图',
/*主标题*/
left: 'center',
/*字体居中*/
subtext: '副标题',
/*副标题*/
show: true,
link: 'http://www.baidu.com',
/*主标题链接*/
target: 'self',
/*self当前窗口,default:blank在新窗口*/
textStyle: { /*调整主标题字体样式*/
color: 'red',
fontSize: 25
}
},
grid: { /*调整视图left,top,right,bottom*/
// left: 'left'
},
xAxis: {
type: 'category',
data: ['Mon', 'Tue', 'Wed', 'Thu', 'Fri', 'Sat', 'Sun']
},
yAxis: {
type: 'value',
name: '金额',
axisLabel: { // 设置y轴的数据格式
formatter: function(value) {
let mun = value / 1000
return mun + 'k'
}
}
},
series: [{
data: [820, 932, 901, 934, 1290, 1330, 1320],
type: 'line', // 设置图形
smooth: true, // 平滑线条图
/*areaStyle: {color: '#999'},// 设置面积*/
// 设置图形,字体的颜色,显示数据和位置
itemStyle: {
normal: {
color: '#3580B8',
label: {
show: true,
position: 'top'
}
}
}
}]
};

