爬取爱奇艺热播版并处理分析
爬取爱奇艺热播榜并处理分析
一:网络爬虫设计方案
爬虫名称:爬取爱奇艺热播榜并处理分析
爬取内容:热播榜的影视剧名称与对应的热度
设计方案概述:
1.找到要爬取的网页,使用F12查看源代码,找到我们要爬取的数据
2.使用get请求和beautifulsoup解析工具进行爬取数据
3.使用pandas进行数据可视化
4.使用matplotlib进行数据分析以及回归方程的绘制
5.最后将数据持久化
技术难点:找到对应数据之间的线性关系,爬取有用的数据,将有碍分析的数据剔除
二:页面的结构分析:
打开所要爬取的网页http://top.iqiyi.com/rebobang.html
2.查看源代码后发现该网页为html结构

并且发现我们所需要的数据在以下标签中
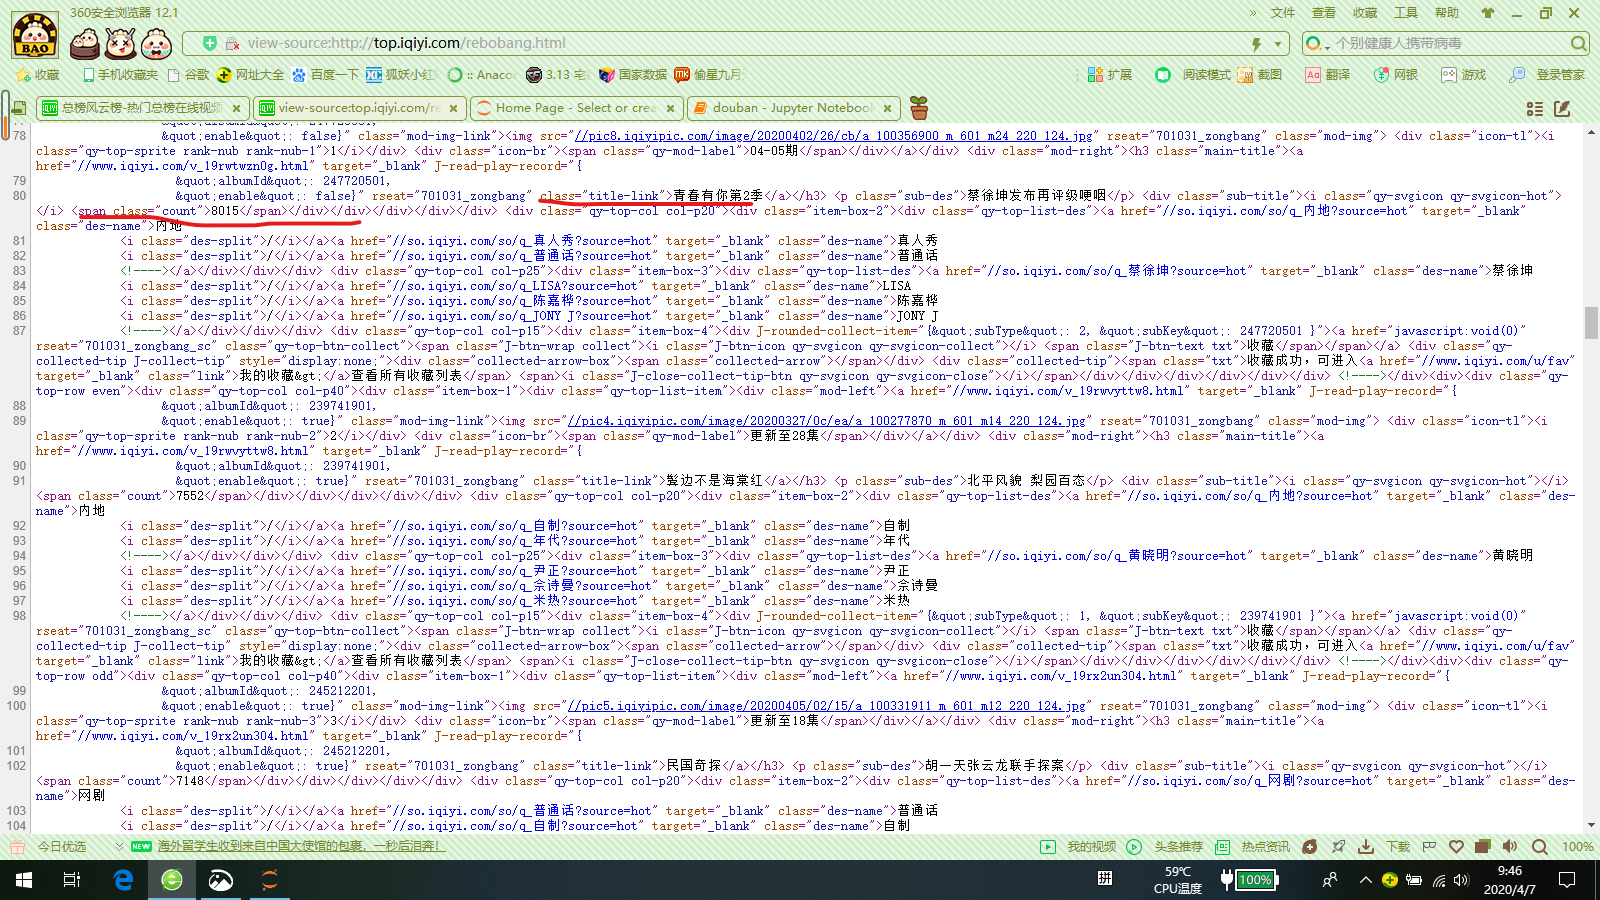
3.于是我们便可以利用find_all函数进行遍历查找的方式爬取
三:爬虫程序设计
先把我们所需要的数据爬取下来
 1 import requests
 2 from bs4 import BeautifulSoup
 3 import pandas as pd
 4 import numpy as np
 5 import scipy as sp
 6 from numpy import genfromtxt
 7 import matplotlib
 8 from pandas import DataFrame
 9 import matplotlib.pyplot as plt
10 from scipy.optimize import leastsq
11 import urllib.request as urlrequest
12 #导入相关库
13 url='http://top.iqiyi.com/rebobang.html'
14 #搜索网址
15 headers={'User-Agent: Mozilla/5.0 (Windows NT 10.0; Win64; x64)AppleWebKit/537.36 (KHTML, like Gecko) Chrome/70.0.3538.102 Safari/537.36 Edge/18.18363'}#伪装爬虫
16 #伪装爬虫
17 r=requests.get(url)
18 #发送get请求
19 r.encoding=r.apparent_encoding
20 #统一编码
21 t=r.text
22 soup=BeautifulSoup(t,'lxml')
23 #使用BeautifulSoup工具解析
24 title=[]
25 count=[]
26 #建立两个空列表
27 for x in soup.find_all(class_="title-link"):
28          title.append(x.get_text().strip())
29 for y in soup.find_all('span',class_="count"):
30          count.append(y.get_text().strip())
31 #使用find_all函数进行遍历查找
32 data=[title,count]
33 #把两个列表收到data变量中
34 print(data)
35 #使用print函数打印
爬取的数据如下图

接下来使用pandas将其数据可视化并保存到excel文件中
1 df=pd.DataFrame(data,index=["名称","热度"])
2 #数据可视化
3 print(df.T)
4 rebo="D:/hotbo.xlsx"
5 df.T.to_excel(rebo)
保存到excel文件的数据如下图
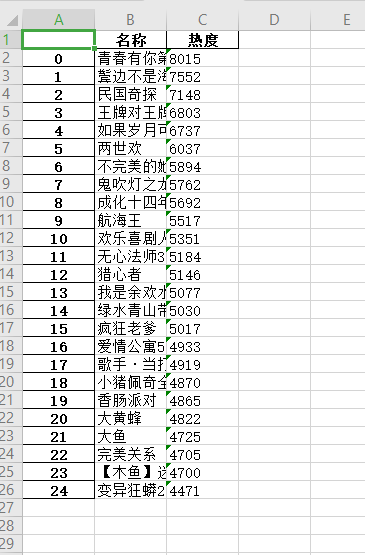
接下来进行数据清洗与处理
 1 #数据清洗
 2 print('\n====各列是否有缺失值情况如下:====')
 3 print(df.isnull())
 4 #统计空值情况
 5 print(df.duplicated())
 6 #查找重复值
 7 print(df.isna().head())
 8 #统计缺失值  # 得出结果为False则不为空值
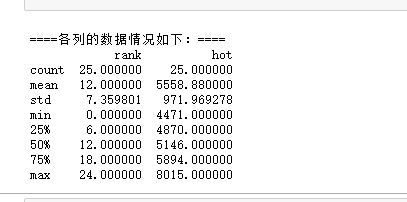
 9 print(df.describe())
10 #描述数据
数据清洗的结果如下图
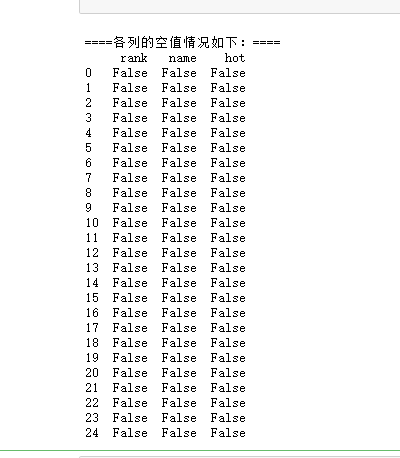
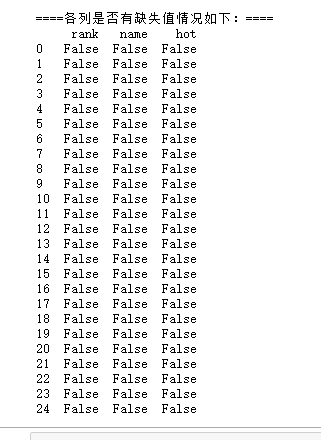
接下来进行数据分析和可视化
 1 file="D:/hotbo.xlsx"
 2 chinese=matplotlib.font_manager.FontProperties(fname='C:/Windows/Fonts/simsun.ttc')
 3 df=pd.read_excel(file,names=["rank","name","hot"])
 4 #使用read函数读取excel文件
 5 plt.rcParams['font.sans-serif']=['Arial Unicode MS']
 6 #用来正常显示中文
 7 plt.rcParams['axes.unicode_minus']=False
 8 #用来正常显示负号
 9
10 #画散点图
11 plt.scatter(df.name,df.hot,alpha=1)
12 #画散点图,名字为X轴,热度为Y轴,大小为1
13 plt.title("影视剧名称与热度统计值")
14 #添加标题
15 plt.grid()
16 plt.show()
17 plt.savefig(fname="D:/影视剧名称与热度统计值.png",figsize=[10,10])
18 #保存图像
19
20 #画直方图
21 data=np.array(df.hot)
22 Names=df.name
23 s=pd.Series(data,Names)
24 s.name='影视剧名称与热度统计值'
25 s.plot(kind='bar',title='影视剧名称与热度统计值')
26 plt.grid()
27 plt.show()
28 plt.savefig(fname="D:/影视剧名称与热度统计值.jpg",figsize=[1,1])
29 #保存到D盘
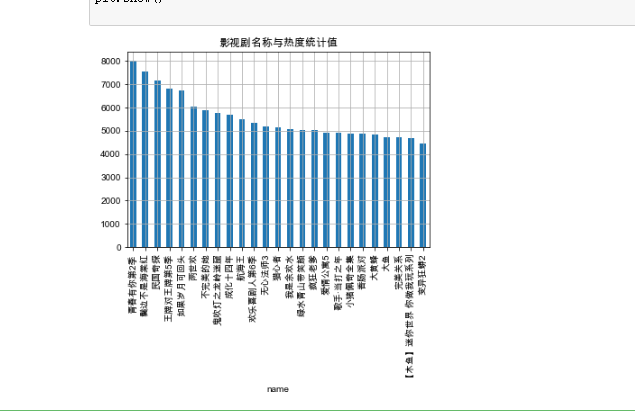
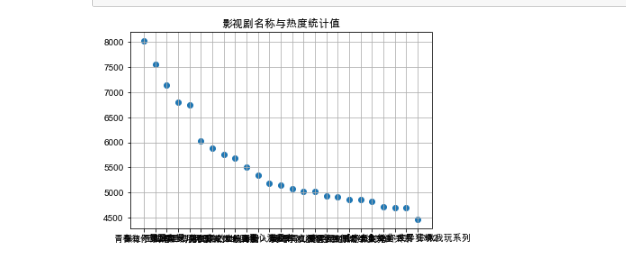
运行结果如下(直方图由于名字问题重叠在一起了,不知道怎么改)
接下来画散点图和回归直线方程
 1 #画一元二次回归方程
 2 chinese=matplotlib.font_manager.FontProperties(fname='C:/Windows/Fonts/simsun.ttc')
 3 #调用中文
 4 plt.rcParams['font.sans-serif']=['Arial Unicode MS']
 5 plt.rcParams['axes.unicode_minus']=False
 6 filename="D:/hotbo.xlsx"
 7 colnames=["rank","name","hot"]
 8 df=pd.read_excel(filename,skiprows=1,names=colnames)
 9 X=df.rank
10 Y=df.hot
11 #确定x,y轴
12 def func(params,x):
13     a,b,c=params
14     return a*x*x+b*x+c
15 def error(params,x,y):
16     #设置误差函数
17     return func(params,x)-y
18 p0=[1978,0]
19 def main():
20     #主函数
21     plt.figure(figsize=(8,6))
22     #画布尺寸
23     p0=[1978,300,1]
24     Para=leastsq(error,p0,args=(X,Y))
25     a,b,c=Para[0]
26     print("a=",a,"b=",b,"c=",c)
27     plt.scatter(X,Y,color="green",label="样本数据",linewidth=2)
28     x=np.linspace(1,25,25)
29     y=a*x*x+b*x+c
30     plt.plot(x,y,color="red",label="拟合曲线",linewidth=2)
31     #画拟合曲线
32     plt.legend()
33     plt.title("影视剧排名与热度统计值")
34     plt.grid()
35     plt.show()
36 main()
37 plt.savefig(fname="D:/影视剧名称与热度统计值回归方程.jpg",figsize=[1,1])
38 #保存图像
运行结果如下

数据持久化

代码汇总如下:
  1 import requests
  2 from bs4 import BeautifulSoup
  3 import pandas as pd
  4 import numpy as np
  5 import scipy as sp
  6 from numpy import genfromtxt
  7 import matplotlib
  8 from pandas import DataFrame
  9 import matplotlib.pyplot as plt
 10 from scipy.optimize import leastsq
 11 import urllib.request as urlrequest
 12 #导入相关库
 13 url='http://top.iqiyi.com/rebobang.html'
 14 #搜索网址
 15 headers={'User-Agent: Mozilla/5.0 (Windows NT 10.0; Win64; x64)AppleWebKit/537.36 (KHTML, like Gecko) Chrome/70.0.3538.102 Safari/537.36 Edge/18.18363'}#伪装爬虫
 16 #伪装爬虫
 17 r=requests.get(url)
 18 #发送get请求
 19 r.encoding=r.apparent_encoding
 20 #统一编码
 21 t=r.text
 22 soup=BeautifulSoup(t,'lxml')
 23 #使用BeautifulSoup工具解析
 24 title=[]
 25 count=[]
 26 #建立两个空列表
 27 for x in soup.find_all(class_="title-link"):
 28          title.append(x.get_text().strip())
 29 for y in soup.find_all('span',class_="count"):
 30          count.append(y.get_text().strip())
 31 #使用find_all函数进行遍历查找
 32 data=[title,count]
 33 #把两个列表收到data变量中
 34 print(data)
 35 #使用print函数打印
 36 df=pd.DataFrame(data,index=["名称","热度"])
 37 #数据可视化
 38 print(df.T)
 39 rebo="D:/hotbo.xlsx"
 40 df.T.to_excel(hotbo)
 41 file="D:/hotbo.xlsx"
 42 chinese=matplotlib.font_manager.FontProperties(fname='C:/Windows/Fonts/simsun.ttc')
 43 df=pd.read_excel(file,names=["rank","name","hot"])
 44 #使用read函数读取excel文件
 45 df.head()
 46
 47 #数据清洗
 48 print('\n====各列是否有缺失值情况如下:====')
 49 print(df.isnull())
 50 #统计空值情况
 51 print(df.duplicated())
 52 #查找重复值
 53 print(df.isna().head())
 54 #统计缺失值  # 得出结果为False则不为空值
 55 print(df.describe())
 56 #描述数据
 57
 58 plt.rcParams['font.sans-serif']=['Arial Unicode MS']
 59 #用来正常显示中文
 60 plt.rcParams['axes.unicode_minus']=False
 61 #用来正常显示负号
 62
 63 #画散点图
 64 plt.scatter(df.name,df.hot,alpha=1)
 65 #画散点图,名字为X轴,热度为Y轴,大小为1
 66 plt.title("影视剧名称与热度统计值")
 67 #添加标题
 68 plt.grid()
 69 plt.show()
 70 plt.savefig(fname="D:/影视剧名称与热度统计值.png",figsize=[10,10])
 71 #保存图像
 72
 73 #画直方图
 74 data=np.array(df.hot)
 75 Names=df.name
 76 s=pd.Series(data,Names)
 77 s.name='影视剧名称与热度统计值'
 78 s.plot(kind='bar',title='影视剧名称与热度统计值')
 79 plt.grid()
 80 plt.show()
 81 plt.savefig(fname="D:/影视剧名称与热度统计值.jpg",figsize=[1,1])
 82 #保存到D盘
 83
 84 #画一元二次回归方程
 85 chinese=matplotlib.font_manager.FontProperties(fname='C:/Windows/Fonts/simsun.ttc')
 86 #调用中文
 87 plt.rcParams['font.sans-serif']=['Arial Unicode MS']
 88 plt.rcParams['axes.unicode_minus']=False
 89 filename="D:/hotbo.xlsx"
 90 colnames=["rank","name","hot"]
 91 df=pd.read_excel(filename,skiprows=1,names=colnames)
 92 X=df.rank
 93 Y=df.hot
 94 #确定x,y轴
 95 def func(params,x):
 96     a,b,c=params
 97     return a*x*x+b*x+c
 98 def error(params,x,y):
 99     #设置误差函数
100     return func(params,x)-y
101 p0=[1978,0]
102 def main():
103     #主函数
104     plt.figure(figsize=(8,6))
105     #画布尺寸
106     p0=[1978,300,1]
107     Para=leastsq(error,p0,args=(X,Y))
108     a,b,c=Para[0]
109     print("a=",a,"b=",b,"c=",c)
110     plt.scatter(X,Y,color="green",label="样本数据",linewidth=2)
111     x=np.linspace(1,25,25)
112     y=a*x*x+b*x+c
113     plt.plot(x,y,color="red",label="拟合曲线",linewidth=2)
114     #画拟合曲线
115     plt.legend()
116     plt.title("影视剧排名与热度统计值")
117     plt.grid()
118     plt.show()
119 main()
120 plt.savefig(fname="D:/影视剧名称与热度统计值回归方程.jpg",figsize=[1,1])
121 #保存图像
四:结论
1.通过这次分析与可视化,了解了当代人对影视剧的倾向方向
2.小结:通过这次爬虫作业,也了解到了自己还有很多的不足,虽然大部分的要求都能达到,但是还是欠缺很大,比如那个直方图的影视剧名称重叠问题不知道该怎么解决,希望自己在未来的学习中可以更加努力。另外python也需要我们继续精进。


