spring-boot-actuator
引入包
  <dependency>
            <groupId>org.springframework.boot</groupId>
            <artifactId>spring-boot-starter-actuator</artifactId>
            <version>${spring.boot.version}</version>
        </dependency>
查看默认支持的
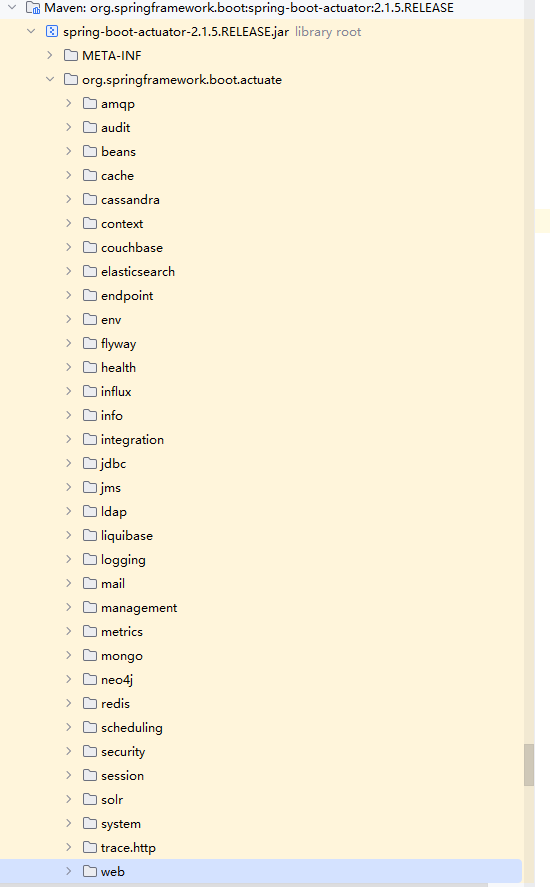
常用API
查看可用的端点
curl http://127.0.0.1:8080/actuator

curl -o /dev/null -s -w "Time: %{time_total}s\n" http://127.0.0.1:8080/actuator
响应


{
    "_links": {
        "self": {
            "href": "http://127.0.0.1:8080/actuator",
            "templated": false
        },
        "archaius": {
            "href": "http://127.0.0.1:8080/actuator/archaius",
            "templated": false
        },
        "arthas": {
            "href": "http://127.0.0.1:8080/actuator/arthas",
            "templated": false
        },
        "nacos-discovery": {
            "href": "http://127.0.0.1:8080/actuator/nacos-discovery",
            "templated": false
        },
        "sentinel": {
            "href": "http://127.0.0.1:8080/actuator/sentinel",
            "templated": false
        },
        "auditevents": {
            "href": "http://127.0.0.1:8080/actuator/auditevents",
            "templated": false
        },
        "beans": {
            "href": "http://127.0.0.1:8080/actuator/beans",
            "templated": false
        },
        "caches": {
            "href": "http://127.0.0.1:8080/actuator/caches",
            "templated": false
        },
        "caches-cache": {
            "href": "http://127.0.0.1:8080/actuator/caches/{cache}",
            "templated": true
        },
        "health-component": {
            "href": "http://127.0.0.1:8080/actuator/health/{component}",
            "templated": true
        },
        "health-component-instance": {
            "href": "http://127.0.0.1:8080/actuator/health/{component}/{instance}",
            "templated": true
        },
        "health": {
            "href": "http://127.0.0.1:8080/actuator/health",
            "templated": false
        },
        "conditions": {
            "href": "http://127.0.0.1:8080/actuator/conditions",
            "templated": false
        },
        "shutdown": {
            "href": "http://127.0.0.1:8080/actuator/shutdown",
            "templated": false
        },
        "configprops": {
            "href": "http://127.0.0.1:8080/actuator/configprops",
            "templated": false
        },
        "env-toMatch": {
            "href": "http://127.0.0.1:8080/actuator/env/{toMatch}",
            "templated": true
        },
        "env": {
            "href": "http://127.0.0.1:8080/actuator/env",
            "templated": false
        },
        "info": {
            "href": "http://127.0.0.1:8080/actuator/info",
            "templated": false
        },
        "logfile": {
            "href": "http://127.0.0.1:8080/actuator/logfile",
            "templated": false
        },
        "loggers": {
            "href": "http://127.0.0.1:8080/actuator/loggers",
            "templated": false
        },
        "loggers-name": {
            "href": "http://127.0.0.1:8080/actuator/loggers/{name}",
            "templated": true
        },
        "heapdump": {
            "href": "http://127.0.0.1:8080/actuator/heapdump",
            "templated": false
        },
        "threaddump": {
            "href": "http://127.0.0.1:8080/actuator/threaddump",
            "templated": false
        },
        "prometheus": {
            "href": "http://127.0.0.1:8080/actuator/prometheus",
            "templated": false
        },
        "metrics-requiredMetricName": {
            "href": "http://127.0.0.1:8080/actuator/metrics/{requiredMetricName}",
            "templated": true
        },
        "metrics": {
            "href": "http://127.0.0.1:8080/actuator/metrics",
            "templated": false
        },
        "scheduledtasks": {
            "href": "http://127.0.0.1:8080/actuator/scheduledtasks",
            "templated": false
        },
        "httptrace": {
            "href": "http://127.0.0.1:8080/actuator/httptrace",
            "templated": false
        },
        "mappings": {
            "href": "http://127.0.0.1:8080/actuator/mappings",
            "templated": false
        },
        "refresh": {
            "href": "http://127.0.0.1:8080/actuator/refresh",
            "templated": false
        },
        "features": {
            "href": "http://127.0.0.1:8080/actuator/features",
            "templated": false
        },
        "service-registry": {
            "href": "http://127.0.0.1:8080/actuator/service-registry",
            "templated": false
        },
        "mq": {
            "href": "http://127.0.0.1:8080/actuator/mq",
            "templated": false
        }
    }
}
查看可用的指标
curl http://127.0.0.1:8080/actuator/metrics
响应
{
    "names": [
        "process.uptime",
        "tomcat.threads.current",
        "kafka.consumer.connection.close.total",
        "jvm.threads.states",
        "sentinel.blockQps",
        "jvm.memory.max",
        "tomcat.sessions.rejected",
        "executor.active",
        "kafka.consumer.records.consumed.total",
        "http.server.requests",
        "process.cpu.usage",
        "jvm.classes.loaded",
        "tomcat.threads.busy",
        "jvm.buffer.memory.used",
        "jvm.memory.committed",
        "sentinel.threadNum",
        "jvm.classes.unloaded",
        "sentinel.oneMinuteException",
        "tomcat.sessions.active.current",
        "sentinel.averageRt",
        "kafka.consumer.fetch.throttle.time.avg",
        "kafka.consumer.fetch.throttle.time.max",
        "kafka.consumer.bytes.consumed.total",
        "jvm.memory.used",
        "tomcat.sessions.alive.max",
        "jvm.gc.live.data.size",
        "sentinel.totalQps",
        "kafka.consumer.join.time.avg",
        "kafka.consumer.join.time.max",
        "kafka.consumer.fetch.total",
        "kafka.consumer.sync.time.avg",
        "kafka.consumer.sync.time.max",
        "kafka.consumer.records.per.request.avg",
        "process.files.open",
        "jvm.gc.pause",
        "kafka.consumer.commit.latency.avg",
        "kafka.consumer.commit.latency.max",
        "kafka.consumer.assigned.partitions",
        "tomcat.sessions.active.max",
        "jvm.minorVersion",
        "sentinel.oneMinuteTotal",
        "kafka.consumer.connection.creation.total",
        "kafka.consumer.connection.count",
        "executor.pool.size",
        "executor.queued",
        "tomcat.global.sent",
        "process.start.time",
        "executor.completed",
        "sentinel.exceptionQps",
        "kafka.consumer.records.lag",
        "kafka.consumer.join.rate",
        "kafka.consumer.commit.rate",
        "kafka.consumer.io-wait-time-avg",
        "sentinel.oneMinuteBlock",
        "process.files.max",
        "tomcat.global.request.max",
        "jvm.gc.memory.promoted",
        "logback.events",
        "sentinel.oneMinutePass",
        "kafka.consumer.fetch.size.avg",
        "kafka.consumer.fetch.size.max",
        "tomcat.global.request",
        "kafka.consumer.io-time-avg",
        "kafka.consumer.heartbeat.rate",
        "system.load.average.1m",
        "kafka.consumer.sync.rate",
        "sentinel.passQps",
        "jvm.gc.max.data.size",
        "kafka.consumer.select.total",
        "kafka.consumer.fetch.latency.avg",
        "kafka.consumer.fetch.latency.max",
        "kafka.consumer.io.ratio",
        "kafka.consumer.io.wait.ratio",
        "system.cpu.count",
        "tomcat.global.received",
        "jvm.buffer.count",
        "kafka.consumer.records.lead.avg",
        "kafka.consumer.records.lead.min",
        "jvm.buffer.total.capacity",
        "sentinel.successQps",
        "kafka.consumer.records.lag.avg",
        "kafka.consumer.records.lag.max",
        "kafka.consumer.last-heartbeat",
        "tomcat.sessions.created",
        "jvm.threads.daemon",
        "system.cpu.usage",
        "jvm.gc.memory.allocated",
        "tomcat.threads.config.max",
        "jvm.majorVersion",
        "tomcat.global.error",
        "tomcat.sessions.expired",
        "kafka.consumer.heartbeat.response.time.max",
        "jvm.threads.live",
        "jvm.threads.peak",
        "kafka.consumer.records.lead"
    ]
}
查看tomcat相关
curl http://127.0.0.1:8080/actuator/metrics/tomcat.threads.busy
响应
{
    "name": "tomcat.threads.busy",
    "description": null,
    "baseUnit": "threads",
    "measurements": [
        {
            "statistic": "VALUE",
            "value": 1.0
        }
    ],
    "availableTags": [
        {
            "tag": "instance",
            "values": [
                "10.42.4.109"
            ]
        },
        {
            "tag": "service",
            "values": [
                "assist-core-toolkit"
            ]
        },
        {
            "tag": "name",
            "values": [
                "http-nio-8080"
            ]
        }
    ]
}
tomcat相关指标解释
Tomcat 相关指标
tomcat.threads.current
含义:当前正在运行的线程数。
用途:监控 Tomcat 服务器的线程池状态,了解当前负载情况。
tomcat.threads.busy
含义:当前正在处理请求的繁忙线程数。
用途:评估服务器的繁忙程度,帮助识别潜在的性能瓶颈。
tomcat.threads.config.max
含义:配置的最大线程数。
用途:确保服务器能够处理的最大并发请求数量,避免因线程不足导致请求失败。
tomcat.sessions.active.current
含义:当前活跃的会话数。
用途:监控当前在线用户的数量,帮助评估系统负载。
tomcat.sessions.active.max
含义:最大活跃会话数。
用途:了解系统在某个时间段内的最大并发用户数,帮助优化会话管理策略。
tomcat.sessions.created
含义:创建的会话总数。
用途:统计一段时间内创建的会话数量,帮助评估系统的使用情况。
tomcat.sessions.expired
含义:过期的会话数。
用途:监控会话的过期情况,帮助优化会话超时设置。
tomcat.sessions.rejected
含义:被拒绝的会话数。
用途:了解因会话管理限制而被拒绝的会话数量,帮助调整会话管理策略。
tomcat.sessions.alive.max
含义:最长存活时间的会话数。
用途:了解会话的最长存活时间,帮助优化会话超时设置。
tomcat.global.request
含义:总的请求数。
用途:统计服务器接收到的总请求数,帮助评估系统的使用情况。
tomcat.global.request.max
含义:最大请求处理时间。
用途:了解处理请求的最长时间,帮助识别性能瓶颈。
tomcat.global.sent
含义:发送的字节数。
用途:统计服务器发送的数据量,帮助评估网络带宽使用情况。
tomcat.global.received
含义:接收的字节数。
用途:统计服务器接收的数据量,帮助评估网络带宽使用情况。
tomcat.global.error
含义:错误请求数。
用途:统计服务器处理请求时发生的错误次数,帮助识别和解决潜在问题。
tomcat.sessions.rejected
含义:被拒绝的会话数。
用途:了解因会话管理限制而被拒绝的会话数量,帮助调整会话管理策略。
总结
这些指标可以帮助您全面了解 Tomcat 服务器的运行状态,包括线程池、会话管理和请求处理等方面。通过监控这些指标,您可以及时发现并解决潜在的性能问题,优化系统性能。
日志atuator
有些时候我们会在业务代码打大量debug,当出现问题时我们需要重放 打印debug的值
初始化类
org.springframework.boot.actuate.logging.LoggersEndpoint
获取某个类的日志级别
curl http://localhost:8080/actuator/loggers/com.yxt.assist.toolkit.anticorruption.baseinfo.adaptor.impl.OrganizationAdapterImpl
动态改变某个类的日志级别
curl -X POST http://127.0.0.1:8080/actuator/loggers/com.yxt.assist.toolkit.server.awardpunishment.service.impl.AwardPunishmentApplicationServiceImpl \
-H "Content-Type: application/vnd.spring-boot.actuator.v2+json;charset=UTF-8" \
--data '{"configuredLevel":"debug"}'
环境变量actuator
排查问题的时候判断是否加载到了我们的最新配置
查询是否有指定环境变量
curl 127.0.0.1:8080/actuator/env/server.port
响应
{
    "property": {
        "source": "ApolloBootstrapPropertySources:application.yml",
        "value": "8080"
    },
    "activeProfiles": [
        "dev"
    ],
    "propertySources": [
        {
            "name": "server.ports"
        },
        {
            "name": "ApolloBootstrapPropertySources:application.yml",
            "property": {
                "value": "8080"
            }
        },
        {
            "name": "ApolloBootstrapPropertySources:application.properties"
        },
        {
            "name": "ApolloBootstrapPropertySources:bizconfig.properties"
        },
        {
            "name": "ApolloBootstrapPropertySources:thirdconfig.properties"
        },
        {
            "name": "ApolloBootstrapPropertySources:common.properties"
        },
        {
            "name": "ApolloPropertySources:application"
        },
        {
            "name": "myEncrypt"
        },
        {
            "name": "servletConfigInitParams"
        },
        {
            "name": "servletContextInitParams"
        },
        {
            "name": "systemProperties"
        },
        {
            "name": "systemEnvironment"
        },
        {
            "name": "random"
        },
        {
            "name": "applicationConfig: [classpath:/application.properties]"
        },
        {
            "name": "springCloudClientHostInfo"
        },
        {
            "name": "yxtSentinelPropertySources:yxtsentinel-dev-param.yml"
        },
        {
            "name": "sentinelPropertySources:yxtsentinel-dev.yml"
        },
        {
            "name": "defaultProperties"
        },
        {
            "name": "Management Server"
        }
    ]
}
健康检查
判断是否健康
curl -I 127.0.0.1:8080/actuator/health
响应
{"status":"UP","details":{"application":{"status":"UP"}}}
方式二:
curl -I -w "time_namelookup: %{time_namelookup}\n time_connect: %{time_connect}\n time_appconnect: %{time_appconnect}\n time_pretransfer: %{time_pretransfer}\n time_redirect: %{time_redirect}\n time_starttransfer: %{time_starttransfer}\n ----------\n time_total: %{time_total}\n" 127.0.0.1:8080/actuator/health
响应
HTTP/1.1 200
traceId: Ignored_Trace
Content-Type: application/vnd.spring-boot.actuator.v2+json;charset=UTF-8
Transfer-Encoding: chunked
Date: Fri, 13 Jun 2025 10:17:06 GMT

time_namelookup: 0.000
 time_connect: 0.000
 time_appconnect: 0.000
 time_pretransfer: 0.000
 time_redirect: 0.000
 time_starttransfer: 0.001
 ----------
 time_total: 0.001
常用场景
获取订阅的feign服务
比如要操作一台机器的dump 获取重启,为了避免影响上游服务调用,先下线,确认是否下线
1、获取nacos服务订阅地址
curl http://127.0.0.1:8080/actuator/nacos-discovery
{
    "subscribe": [],
    "NacosDiscoveryProperties": {
        "serverAddr": "http://xxxx.:8848",
        "endpoint": "",
        "namespace": "14e1cfa8-6d8b-4540-8634-2e2d04831aa7",
        "watchDelay": 30000,
        "logName": "",
        "service": "assist-gateway",
        "weight": 1.0,
        "clusterName": "DEFAULT",
        "namingLoadCacheAtStart": "false",
        "metadata": {
            "department": "NR",
            "preserved.register.source": "SPRING_CLOUD"
        },
        "registerEnabled": true,
        "ip": "10.100.64.11",
        "networkInterface": "",
        "port": 8080,
        "secure": false,
        "accessKey": "",
        "secretKey": "",
        "heartBeatInterval": null,
        "heartBeatTimeout": null,
        "ipDeleteTimeout": null
    }
}
2、根据nacos地址查询服务
curl -X GET "http://xxxx:8848/nacos/v1/ns/instance/list?serviceName=yxt-basis&namespaceId=xxxx"
经过测试下线后会搜索不到
下线前
{
    "name": "DEFAULT_GROUP@@assist-synthesis",
    "groupName": "DEFAULT_GROUP",
    "clusters": "",
    "cacheMillis": 10000,
    "hosts": [
        {
            "instanceId": "10.42.6.79#8080#DEFAULT#DEFAULT_GROUP@@assist-synthesis",
            "ip": "10.42.6.79",
            "port": 8080,
            "weight": 1.0,
            "healthy": true,
            "enabled": true,
            "ephemeral": true,
            "clusterName": "DEFAULT",
            "serviceName": "DEFAULT_GROUP@@assist-synthesis",
            "metadata": {
                "sys.start": "20250911190030",
                "git.commit.id": "564a10f0c355ee48ef62df37a8d61ee06393189f",
                "meta.ops.git.tag": "dev",
                "git.branch": "564a10f0c355ee48ef62df37a8d61ee06393189f",
                "preserved.register.source": "SPRING_CLOUD",
                "git.commit.time": "2025-09-11T10:55:09Z",
                "git.build.time": "2025-09-11T10:56:13Z",
                "meta.ops.pod.name": "middle-assist-synthesis-deployment-6945789f78-rnzst",
                "meta.ops.env": "dev"
            },
            "instanceHeartBeatInterval": 5000,
            "instanceHeartBeatTimeOut": 15000,
            "ipDeleteTimeout": 30000
        }
    ],
    "lastRefTime": 1758020955725,
    "checksum": "",
    "allIPs": false,
    "reachProtectionThreshold": false,
    "valid": true
}
下线后
{
    "name": "DEFAULT_GROUP@@assist-synthesis",
    "groupName": "DEFAULT_GROUP",
    "clusters": "",
    "cacheMillis": 10000,
    "hosts": [],
    "lastRefTime": 1758020976227,
    "checksum": "",
    "allIPs": false,
    "reachProtectionThreshold": false,
    "valid": true
}
打印SQL
curl -X POST http://127.0.0.1:8080/actuator/loggers/druid.sql.Statement \
-H "Content-Type: application/vnd.spring-boot.actuator.v2+json;charset=UTF-8" \
--data '{"configuredLevel":"debug"}'

Slf4jLogFilter

    protected String dataSourceLoggerName = "druid.sql.DataSource";
    protected String connectionLoggerName = "druid.sql.Connection";
    protected String statementLoggerName = "druid.sql.Statement";
    protected String resultSetLoggerName = "druid.sql.ResultSet";
需要yml配置
        druid:
            initial-size: 8
            min-idle: 1
            max-active: 20
            max-wait: 60000
            time-between-eviction-runsMillis: 60000
            min-evictable-idle-timeMillis: 300000
            validation-query: select 'x' FROM DUAL
            test-while-idle: true
            test-on-borrow: false
            test-on-return: false
            pool-prepared-statements: true
            #max-open-prepared-statements: 20
            max-pool-prepared-statement-per-connection-size: 20
            filters: slf4j  --开启

 浙公网安备 33010602011771号