mysql故障排查
mysql最大连接数量
一般我们应用程序要设置连接池大小,比如我们一台物理机设置的是200 集群部署4台 最大峰值会是800 但是mysql默认是151 当链接获取完,同时连接池也不会释放,其他程序会报错获取连接超时
所以当程序慢,我们排查不能只看mysql负载,还要结合以下信息一起看

默认取值范围

但是具体值需要根据mysql服务器内存计算
以下配置加起来,就是mysql各个连接占用的最大内存 当然以下可以自己设置 根据自己机器实际情况计算

可以通过此脚本动态计算
#!/bin/sh
# you might want to add some user authentication here
mysql -u root -p -h localhost -P 3306 -e "show variables; show status" | awk '
{
VAR[$1]=$2
}
END {
MAX_CONN = VAR["max_connections"]
MAX_USED_CONN = VAR["Max_used_connections"]
BASE_MEM=VAR["key_buffer_size"] + VAR["query_cache_size"] + VAR["innodb_buffer_pool_size"] + VAR["innodb_additional_mem_pool_size"] + VAR["innodb_log_buffer_size"]
MEM_PER_CONN=VAR["read_buffer_size"] + VAR["read_rnd_buffer_size"] + VAR["sort_buffer_size"] + VAR["join_buffer_size"] + VAR["binlog_cache_size"] + VAR["thread_stack"] + VAR["tmp_table_size"]
MEM_TOTAL_MIN=BASE_MEM + MEM_PER_CONN*MAX_USED_CONN
MEM_TOTAL_MAX=BASE_MEM + MEM_PER_CONN*MAX_CONN
printf "+------------------------------------------+--------------------+\n"
printf "| %40s | %15.3f MB |\n", "key_buffer_size", VAR["key_buffer_size"]/1048576
printf "| %40s | %15.3f MB |\n", "query_cache_size", VAR["query_cache_size"]/1048576
printf "| %40s | %15.3f MB |\n", "innodb_buffer_pool_size", VAR["innodb_buffer_pool_size"]/1048576
printf "| %40s | %15.3f MB |\n", "innodb_additional_mem_pool_size", VAR["innodb_additional_mem_pool_size"]/1048576
printf "| %40s | %15.3f MB |\n", "innodb_log_buffer_size", VAR["innodb_log_buffer_size"]/1048576
printf "+------------------------------------------+--------------------+\n"
printf "| %40s | %15.3f MB |\n", "BASE MEMORY", BASE_MEM/1048576
printf "+------------------------------------------+--------------------+\n"
printf "| %40s | %15.3f MB |\n", "sort_buffer_size", VAR["sort_buffer_size"]/1048576
printf "| %40s | %15.3f MB |\n", "read_buffer_size", VAR["read_buffer_size"]/1048576
printf "| %40s | %15.3f MB |\n", "read_rnd_buffer_size", VAR["read_rnd_buffer_size"]/1048576
printf "| %40s | %15.3f MB |\n", "join_buffer_size", VAR["join_buffer_size"]/1048576
printf "| %40s | %15.3f MB |\n", "thread_stack", VAR["thread_stack"]/1048576
printf "| %40s | %15.3f MB |\n", "binlog_cache_size", VAR["binlog_cache_size"]/1048576
printf "| %40s | %15.3f MB |\n", "tmp_table_size", VAR["tmp_table_size"]/1048576
printf "+------------------------------------------+--------------------+\n"
printf "| %40s | %15.3f MB |\n", "MEMORY PER CONNECTION", MEM_PER_CONN/1048576
printf "+------------------------------------------+--------------------+\n"
printf "| %40s | %18d |\n", "Max_used_connections", MAX_USED_CONN
printf "| %40s | %18d |\n", "max_connections", MAX_CONN
printf "+------------------------------------------+--------------------+\n"
printf "| %40s | %15.3f MB |\n", "TOTAL (MIN)", MEM_TOTAL_MIN/1048576
printf "| %40s | %15.3f MB |\n", "TOTAL (MAX)", MEM_TOTAL_MAX/1048576
printf "+------------------------------------------+--------------------+\n"
}'
查询正在执行的sql
用于排查持续挂起查询的sql 用于mysql连接堵塞 确定是哪些慢sql 因为现在程序都使用了连接池,我们都看非sleep的堵塞链接
show processlist;

上面是我的测试 那条sql执行了15秒 结果还没有拿回来
上面可能截断可以尝试以下
select * from information_schema.processlist where command != 'sleep' order by `Time` desc
如果有大量的耗时比较长的慢sql堵塞 同时空闲链接数量比较小的话 可以考虑优化慢sql
#查看空闲链接
select  count(1) from information_schema.processlist where command = 'sleep'
如果没有大量比较耗时的慢sql 空闲链接比较小 同时连接数已经设置合理 可以考虑控制程序的并发限制增加中间件缓存之类的
mysql超时相关配置

慢日志
如何通过阿里云定位慢sql
现在一般用阿里云的rds,结合阿里云rds查看


主要看执行次数和执行时间,如果执行次数比较多,等待时间太长 会导致长时间占用连接,导致连接占满 没有足够的可用链接执行任务
定位慢sql后
注:最终想表达的是,不能只关注sql本身来优化,还要关注业务层面,光看sql可能就没有优化空间
1.首先根据sql看有没有优化空间

2.查看执行计划
扫描取件范围 又是count 索引正常没有优化空间

3.了解业务,定位代码
发现是分页查询,分页接口每次查询都带有count
count需要扫描出所有符合条件的数据求count
优化方案
方案1:
1.针对相同条件,分页过程中(比如page大于1)count增加缓存
1.针对想通条件列表count大于一定范围才走缓存
锁相关
https://www.cnblogs.com/LQBlog/p/10133758.html#autoid-6-0-0
参考文章
https://mp.weixin.qq.com/s/_90oeKftUWhRAAiYQMQefw
高CPU排查

如果做了读写分离
1.读库高CPU 2种情况,一种是QPS升高,一种是慢SQL(常见),搜索这个时间是不是有慢sql。如果没有则查看数据库的QPS,使用云数据库都有对应的监控页面
2.写库高CPU的话需要对业务中并发大量的写清楚,可以去查看那段时间的写多的场景的表是否有大量写入。比如查询当时的任务相关表
本次峰值到48%为2024-10-12 15:20待办任务【xxxx任务】下发到33077多员工任务项大量写导致,正常业务CPU消耗,任务创建完成CPU回归正常水位10%+
库表占用情况
SELECT
    TABLE_SCHEMA AS '数据库',
    TABLE_NAME AS '表名',
    TABLE_ROWS AS '行数',
    CONCAT(ROUND(DATA_LENGTH / 1024 / 1024, 2), 'MB') AS '数据大小',
    CONCAT(ROUND(INDEX_LENGTH / 1024 / 1024, 2), 'MB') AS '索引大小',
    CONCAT(ROUND((DATA_LENGTH + INDEX_LENGTH) / 1024 / 1024, 2), 'MB') AS '总大小'
FROM
    information_schema.TABLES
WHERE
    TABLE_SCHEMA NOT IN ('information_schema', 'performance_schema', 'mysql', 'sys') and TABLE_SCHEMA='assist_core_toolkit'
ORDER BY
    (DATA_LENGTH + INDEX_LENGTH) DESC;

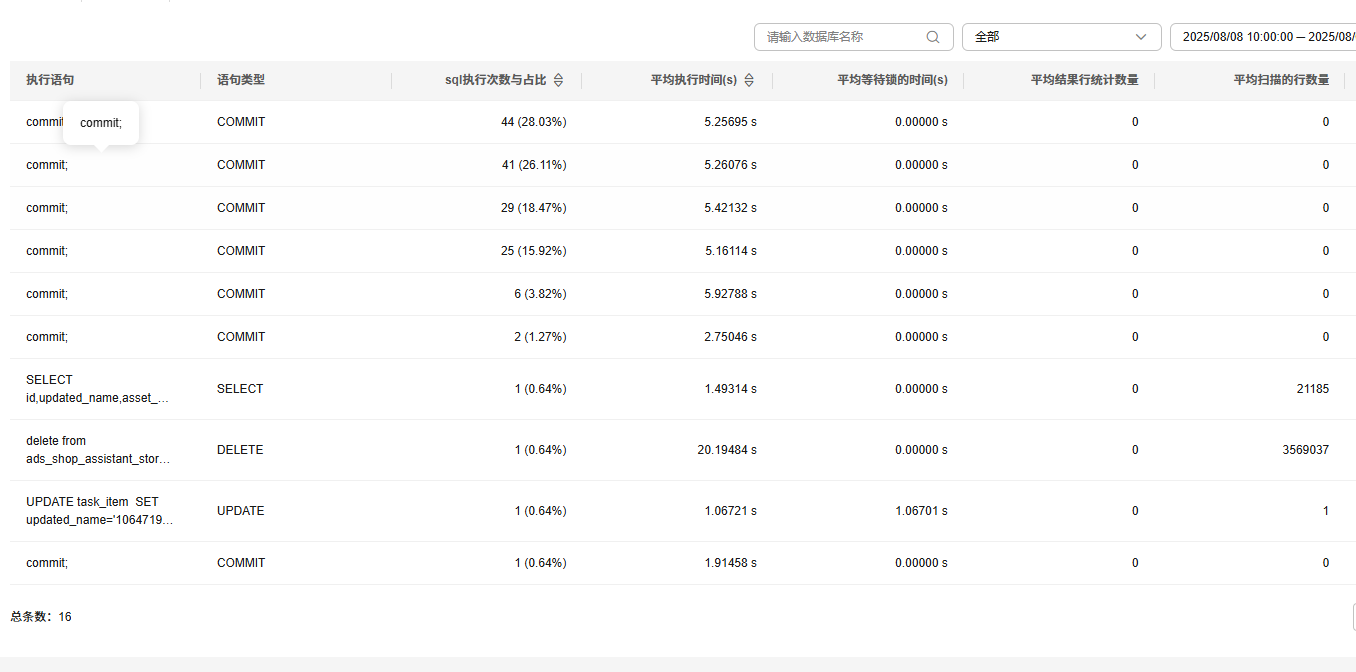
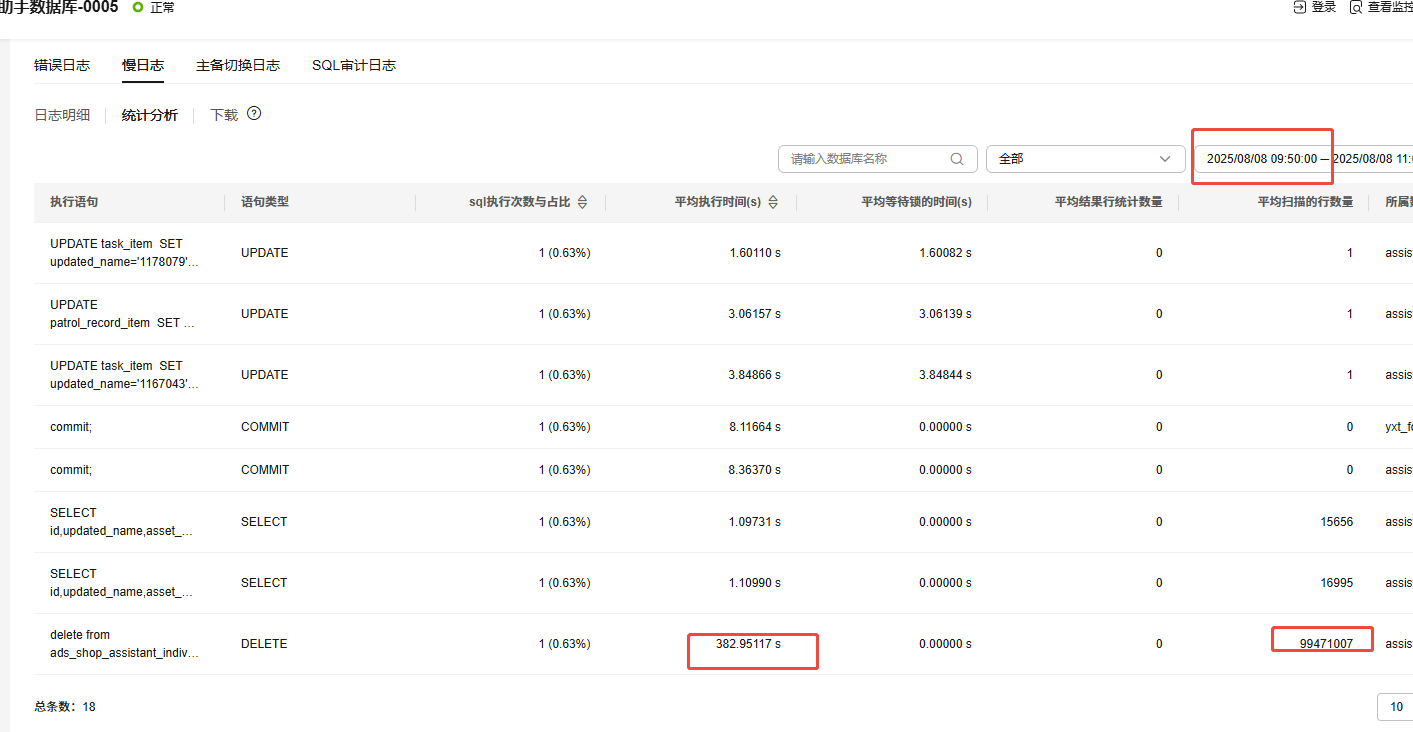
大量Commit SQL慢日志分析
1、10:02出现大量sql超时。
2、查看慢日志,全是commit

3、下载出来归类,有些云厂商工具也提供这个功能

3、高度怀疑这个delete,如果没有找到可以把时间再往前方
4、最终发现是这个sql执行了300多秒 算出来差不多是那个时间 导致binlog 空间占满

 浙公网安备 33010602011771号