Echarts:自定义柱状图(两组数据+颜色渐变)

环境:Vue3+JS+Vite+scss


示例:
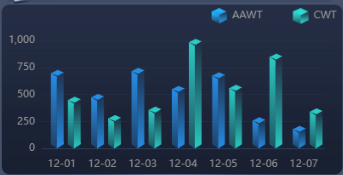
 

一: 图形绘制

可根据需求在左侧面、右侧面、顶面的三个函数中设置各个面的四角位置

// 绘制左侧面
const CubeLeft = echarts.graphic.extendShape({
    shape: {
        x: 0,
        y: 0,
    },
    buildPath: function (ctx, shape) {
        // 会canvas的应该都能看得懂,shape是从custom传入的
        const xAxisPoint = shape.xAxisPoint;
        const c0 = [shape.x - 6, shape.y + 3];//右上角
        const c1 = [shape.x - 13, shape.y - 1];//左上角
        const c2 = [xAxisPoint[0] - 13, xAxisPoint[1] - 5];//左下角
        const c3 = [xAxisPoint[0] - 6, xAxisPoint[1]];//右下角
        ctx.moveTo(c0[0], c0[1]).lineTo(c1[0], c1[1]).lineTo(c2[0], c2[1]).lineTo(c3[0], c3[1]).closePath();
    },
});
// 绘制右侧面
const CubeRight = echarts.graphic.extendShape({
    shape: {
        x: 0,
        y: 0,
    },
    buildPath: function (ctx, shape) {
        const xAxisPoint = shape.xAxisPoint;
        const c1 = [shape.x - 6, shape.y];//左上
        const c2 = [xAxisPoint[0] - 6, xAxisPoint[1]];//左下
        const c3 = [xAxisPoint[0] + 2, xAxisPoint[1] - 5];//右下
        const c4 = [shape.x + 2, shape.y - 3];//右上
        ctx.moveTo(c1[0], c1[1]).lineTo(c2[0], c2[1]).lineTo(c3[0], c3[1]).lineTo(c4[0], c4[1]).closePath();
    },
});
// 绘制顶面
const CubeTop = echarts.graphic.extendShape({
    shape: {
        x: 0,
        y: 0,
    },
    buildPath: function (ctx, shape) {
        const c1 = [shape.x - 5, shape.y + 2];//
        const c2 = [shape.x + 2, shape.y - 2]; //右点
        const c3 = [shape.x - 5, shape.y - 5];//
        const c4 = [shape.x -13, shape.y - 1];//
        ctx.moveTo(c1[0], c1[1]).lineTo(c2[0], c2[1]).lineTo(c3[0], c3[1]).lineTo(c4[0], c4[1]).closePath();
    },
});

二:两组柱的分离以及渐变色设置


(关键代码)

renderItem: (params, api) => {
                    let cubeLeftStyle = ''
                    let cubeRightStyle = ''
                    let cubeTopStyle = '';
                        cubeLeftStyle=new echarts.graphic.LinearGradient(0, 0, 0, 1, [{
                            offset: 0,
                            color: '#29cbc3'
                        }, {
                            offset: 1,
                            color: 'rgba(40, 200, 193, 0.3)'
                        }])
                        cubeRightStyle=new echarts.graphic.LinearGradient(0, 0, 0, 1, [{
                            offset: 0,
                            color: 'rgba(40, 200, 193, 0)'
                        }, {
                            offset: 1,
                            color: '#29cbc3'
                        }])
                        cubeTopStyle=new echarts.graphic.LinearGradient(0, 0, 0, 1, [{
                            offset: 0,
                            color: '#29cbc3'
                        }, {
                            offset: 1,
                            color: '#29cbc3'
                        }])
                    const location = api.coord([api.value(0), api.value(1)])
                    const offsetX = 20;//--------------------设置X轴偏移量-------------------------------
                    return {
                        type: 'group',
                        children: [{
                            type: 'CubeLeft',
                            shape: {
                                api,
                                xValue: api.value(0),
                                yValue: api.value(1),
                                x: location[0]+offsetX,
                                y: location[1],
                                xAxisPoint: api.coord([api.value(0), 0]).map((item,i)=>(i===0 ? item + offsetX : item))//----------------------组别判断---------------------
                            },
                            style: {
                                fill: cubeLeftStyle
                            }
                        }, {
                            type: 'CubeRight',
                            shape: {
                                api,
                                xValue: api.value(0),
                                yValue: api.value(1),
                                x: location[0]+offsetX,
                                y: location[1],
                                xAxisPoint: api.coord([api.value(0), 0]).map((item,i)=>(i===0 ? item + offsetX : item))
                            },
                            style: {
                                fill:cubeRightStyle
                            }
                        },
                         {
                            type: 'CubeTop',
                            shape: {
                                api,
                                xValue: api.value(0),
                                yValue: api.value(1),
                                x: location[0]+offsetX,
                                y: location[1],
                                xAxisPoint: api.coord([api.value(0), 0]).map((item,i)=>(i===0 ? item + offsetX : item))
                            },
                            style: {
                                fill: cubeTopStyle
                            }
                        },
                        ]
                    }
                },


完整代码:

在<script>中引入:

import { onMounted, ref } from "vue";
import * as echarts from "echarts";

<template>


<script>

 let barEcharts = echarts.init(barRef.value);//-----------------barRef为我自己设置的ref--------------------
    let baroption = {
    //  backgroundColor: "#03155C",
     legend: {
         data: [{
                name:"AAWT",
                icon:'image://assets/2d/AAWT_slices/legendAAWT.png',
             }, {
                name:"CWT",
                icon:'image://assets/2d/AAWT_slices/legendCWT.png',
        }],
        //  top: '1%',
         textStyle: {
             color: "#999",
             fontSize: 12,
         },
         right:0,
         top:40,
         itemWidth: 20,
         itemHeight: 20,
         itemGap: 35,
         color: "#fff",
         selectedMode: false,
     },
     grid: {
            top: '35%',
            left: '12%',
            right: '5%',
            bottom: '12%',
            containLabel: false,
        },
     xAxis: {
         type: "category",
         data: ['12-01', '12-02', '12-03', '12-04', '12-05', '12-06', '12-07'],
         axisLine: {
             show: true,
             lineStyle: {
                 color: "rgba(45, 60, 92, 1)",
             },
         },
         axisTick: {
             show: false,
         },
         axisLabel: {
             // interval: 0,
             // rotate: 40,
             textStyle: {
                 fontFamily: "Microsoft YaHei",
                 color: "#999", // x轴颜色
                 fontWeight: "normal",
                 fontSize: "12",
                 lineHeight: 22,
             },
             interval: 0, //标签设置为全部显示
            //  margin: 15,
             lineHeight: 15,
         },
     },

     yAxis: [
        {
            min: 0,
            max: 1000,
            interval:250,
            type: "value",
            name: '',
            nameTextStyle: {
                color: '#fff',
                fontSize: '12px'
            },
            axisLine: {
                show: false,
                lineStyle: {
                    color: "rgba(45, 60, 92, 1)",
                },
            },
            splitLine: {
                show: true,
                lineStyle: {
                    color: "rgba(45, 60, 92, .3)", //左侧显示线
                },
            },
            axisTick: {
                show: false,
            },
            axisLabel: {
               //  formatter: "{value}%",
                textStyle: {
                    color: "#999",
                    fontSize: 12,
                },
            },
        },
     ],
     series: [
          {
                name: "AAWT",
                stack: "1",
                type: 'custom',
                renderItem: (params, api) => {
                    let cubeLeftStyle = ''
                    let cubeRightStyle = ''
                    let cubeTopStyle = ''
                    // if(params.dataIndex){
                        cubeLeftStyle=new echarts.graphic.LinearGradient(0, 0, 0, 1, [{
                            offset: 0,
                            color: '#268de4'
                        }, {
                            offset: 1,
                            color: 'rgba(38, 141, 228, .3)'
                        }])
                        cubeRightStyle=new echarts.graphic.LinearGradient(0, 0, 0, 1, [{
                            offset: 0,
                            color: 'rgba(38, 141, 228, .1)'
                        }, {
                            offset: 1,
                            color: '#268de4'
                        }])
                        cubeTopStyle=new echarts.graphic.LinearGradient(0, 0, 0, 1, [{
                            offset: 0,
                            color: '#268de4'
                        }, {
                            offset: 1,
                            color: '#268de4'
                        }])
                    const location = api.coord([api.value(0), api.value(1)])
                    return {
                        type: 'group',
                        children: [{
                            type: 'CubeLeft',
                            shape: {
                                api,
                                xValue: api.value(0),
                                yValue: api.value(1),
                                x: location[0],
                                y: location[1],
                                xAxisPoint: api.coord([api.value(0), 0])
                            },
                            style: {
                                fill: cubeLeftStyle
                            }
                        }, {
                            type: 'CubeRight',
                            shape: {
                                api,
                                xValue: api.value(0),
                                yValue: api.value(1),
                                x: location[0],
                                y: location[1],
                                xAxisPoint: api.coord([api.value(0), 0])
                            },
                            style: {
                                fill:cubeRightStyle
                            }
                        },
                         {
                            type: 'CubeTop',
                            shape: {
                                api,
                                xValue: api.value(0),
                                yValue: api.value(1),
                                x: location[0],
                                y: location[1],
                                xAxisPoint: api.coord([api.value(0), 0])
                            },
                            style: {
                                fill: cubeTopStyle
                            }
                        },
                        ]
                    }
                },
                data: zzx1
            },
            {
                name: "CWT",
                stack: "2",
                type: 'custom',
                renderItem: (params, api) => {
                    let cubeLeftStyle = ''
                    let cubeRightStyle = ''
                    let cubeTopStyle = '';
                        cubeLeftStyle=new echarts.graphic.LinearGradient(0, 0, 0, 1, [{
                            offset: 0,
                            color: '#29cbc3'
                        }, {
                            offset: 1,
                            color: 'rgba(40, 200, 193, 0.3)'
                        }])
                        cubeRightStyle=new echarts.graphic.LinearGradient(0, 0, 0, 1, [{
                            offset: 0,
                            color: 'rgba(40, 200, 193, 0)'
                        }, {
                            offset: 1,
                            color: '#29cbc3'
                        }])
                        cubeTopStyle=new echarts.graphic.LinearGradient(0, 0, 0, 1, [{
                            offset: 0,
                            color: '#29cbc3'
                        }, {
                            offset: 1,
                            color: '#29cbc3'
                        }])
                    const location = api.coord([api.value(0), api.value(1)])
                    const offsetX = 20;
                    return {
                        type: 'group',
                        children: [{
                            type: 'CubeLeft',
                            shape: {
                                api,
                                xValue: api.value(0),
                                yValue: api.value(1),
                                x: location[0]+offsetX,
                                y: location[1],
                                xAxisPoint: api.coord([api.value(0), 0]).map((item,i)=>(i===0 ? item + offsetX : item))
                            },
                            style: {
                                fill: cubeLeftStyle
                            }
                        }, {
                            type: 'CubeRight',
                            shape: {
                                api,
                                xValue: api.value(0),
                                yValue: api.value(1),
                                x: location[0]+offsetX,
                                y: location[1],
                                xAxisPoint: api.coord([api.value(0), 0]).map((item,i)=>(i===0 ? item + offsetX : item))
                            },
                            style: {
                                fill:cubeRightStyle
                            }
                        },
                         {
                            type: 'CubeTop',
                            shape: {
                                api,
                                xValue: api.value(0),
                                yValue: api.value(1),
                                x: location[0]+offsetX,
                                y: location[1],
                                xAxisPoint: api.coord([api.value(0), 0]).map((item,i)=>(i===0 ? item + offsetX : item))
                            },
                            style: {
                                fill: cubeTopStyle
                            }
                        },
                        ]
                    }
                },
                data: wgx1,zzx1
            },
     ],
 }; 
    barEcharts.setOption(baroption);


c403714d-3fa2-434c-900f-09d8a7e12f65
posted on 2022-12-30 11:36  香香鲲  阅读(3069)  评论(1编辑  收藏  举报