C# pythonnet(2)_FFT傅里叶变换
Python代码如下
import pandas as pd
import numpy as np
import matplotlib.pyplot as plt

# 读取数据
data = pd.read_csv('clean_data_row.csv')
# 进行傅里叶变换
fft_result = np.fft.fft(data)
frequencies = np.fft.fftfreq(len(data))

# 计算功率谱密度
power_spectrum = np.abs(fft_result)**2 / len(data)
print(len(power_spectrum))
frequencies_positive = frequencies[:len(frequencies)//2]

# 绘制频谱图和功率谱密度图
# 频谱图
plt.figure(figsize=(12, 6))
plt.subplot(1, 2, 1)
plt.plot(frequencies, np.abs(fft_result))
plt.xlabel('Frequency (Hz)')
plt.ylabel('Amplitude')
plt.title('Frequency Spectrum')
# 功率谱密度图
plt.subplot(1, 2, 2)
plt.plot(frequencies_positive, power_spectrum[:len(power_spectrum)//2])
plt.xlabel('Frequency (Hz)')
plt.ylabel('Power')
plt.title('Power Spectrum Density')

plt.tight_layout()
plt.show()
下面我们修改成C#代码
创建控制台程序,Nuget安装 CsvHelper 和 pythonnet
public class Program
{
    const string PathToPythonDir = "D:\\Python311";
    const string DllOfPython = "python311.dll";

    static void Main(string[] args)
    {
        // 傅里叶变换
        FFT();
    }
    /// <summary>
    /// 傅里叶变换
    /// </summary>
    static void FFT()
    {
        try
        {
            Runtime.PythonDLL = Path.Combine(PathToPythonDir, DllOfPython);
            PythonEngine.Initialize();
            using (Py.GIL())
            {
                dynamic pd = Py.Import("pandas");
                dynamic np = Py.Import("numpy");
                dynamic plt = Py.Import("matplotlib.pyplot");
                dynamic fft = Py.Import("scipy.fftpack");

                using dynamic scope = Py.CreateScope();
                scope.Exec(@"def get_slice(net_array): return net_array[:len(net_array)//2]");

                // 读取数据
                var data = pd.read_csv("clean_data_row.csv");
                int listLength = data.__len__();
                Console.WriteLine("读取长度:" + listLength);

                // 进行傅里叶变换
                var fft_result = fft.fft(data); // 对数据进行傅里叶变换
                var frequencies = fft.fftfreq(listLength);

                // 计算功率谱密度
                var power_spectrum = np.square(np.abs(fft_result)) / listLength;
                var frequencies_positive = scope.get_slice(frequencies);

                /*
                // 如果是api接口,直接返回x轴和y轴数据
                double[] xAxis = frequencies.As<double[]>();
                PyObject yAxisDatas = np.abs(fft_result);
                double[][] yAxis = yAxisDatas.As<dynamic[]>()
                    .Select(s => (double[])s.As<double[]>())
                    .ToArray();

                double[] xAxis2 = xAxis.Take(listLength / 2).ToArray();
                PyObject yAxisDatas2 = power_spectrum;
                double[][] yAxis2 = yAxisDatas2.As<dynamic[]>()
                    .Select(s => (double[])s.As<double[]>())
                    .Take(listLength / 2)
                    .ToArray();
                */

                // 绘制频谱图和功率谱密度图
                plt.figure(figsize: new dynamic[] { 12, 6 });

                // 频谱图
                plt.subplot(1, 2, 1);
                plt.plot(frequencies, np.abs(fft_result));
                plt.xlabel("Frequency (Hz)");
                plt.ylabel("Amplitude");
                plt.title("Frequency Spectrum");

                // 功率谱密度图
                plt.subplot(1, 2, 2);
                plt.plot(frequencies_positive, scope.get_slice(power_spectrum));
                plt.xlabel("Frequency (Hz)");
                plt.ylabel("Power");
                plt.title("Power Spectrum Density");

                // 布局调整,防止重叠
                plt.tight_layout();
                // 显示图表
                plt.show();
            }
        }
        catch (Exception e)
        {
            Console.WriteLine("报错了:" + e.Message + "\r\n" + e.StackTrace);
        }
    }

    /// <summary>
    /// 读取CSV数据
    /// </summary>
    /// <param name="filePath">文件路径</param>
    /// <returns>文件中数据集合,都是double类型</returns>
    static List<double[]> ReadCsvWithCsvHelper(string filePath)
    {
        using (var reader = new StreamReader(filePath))
        using (var csv = new CsvReader(reader, CultureInfo.InvariantCulture))
        {
            var result = new List<double[]>();
            // 如果你的CSV文件有标题行,可以调用ReadHeader来读取它们
            csv.Read();
            csv.ReadHeader();
            while (csv.Read())
            {
                result.Add(new double[] {
                csv.GetField<double>(0),
                csv.GetField<double>(1),
                csv.GetField<double>(2),
            });
            }
            return result;
        }
    }
}
以下是运行后结果,
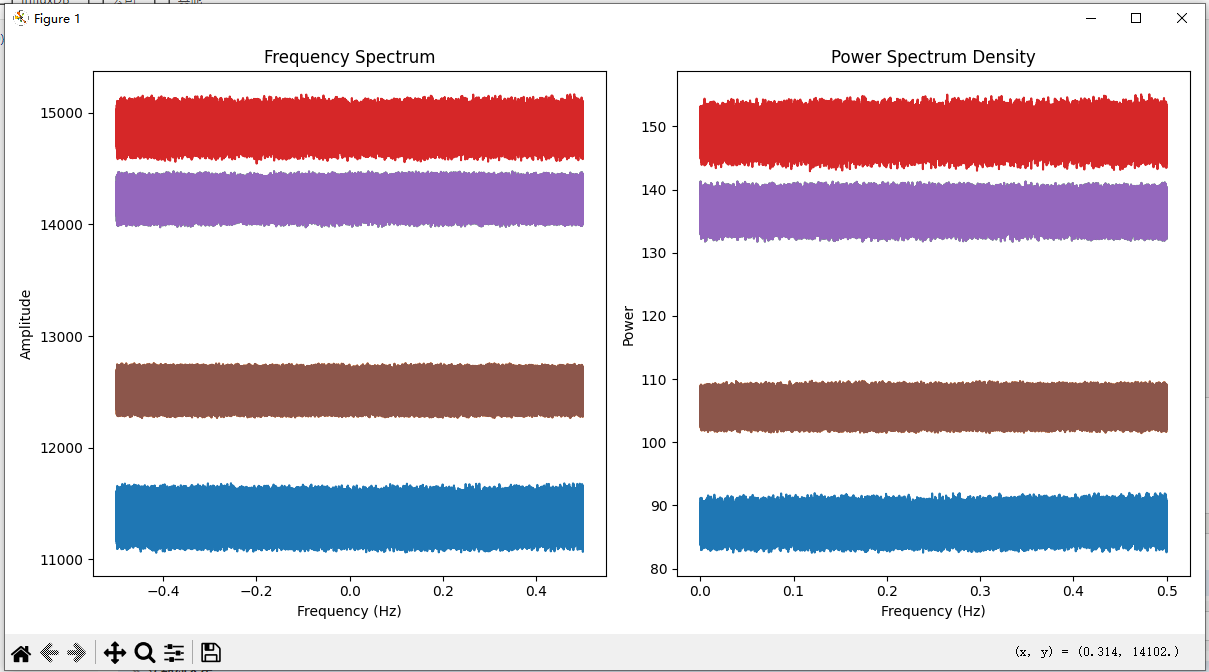
源代码:https://gitee.com/Karl_Albright/csharp-demo/tree/master/PythonnetDemo/PythonnetFFT
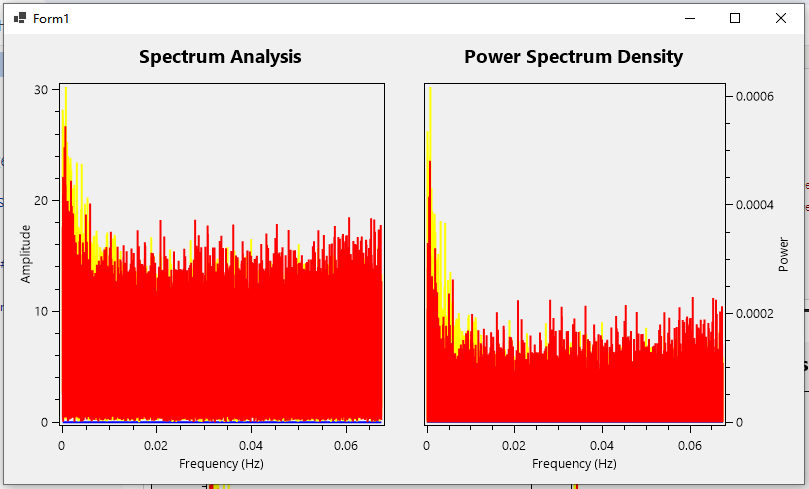
这里有人会问,为什么不用 MathNet.Numerics 直接计算,因为计算结果和Python的结果差别太大了,希望有知道为什么的大佬留言,这里我也记录以下实现步骤
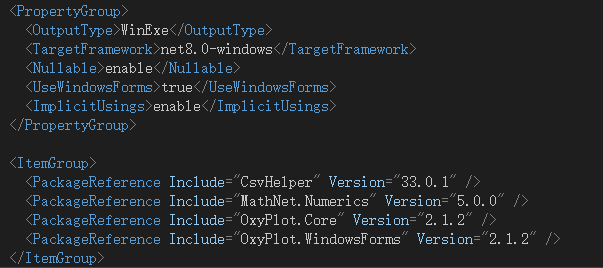
创建Windows 窗体应用(WinForm),Nuget安装 CsvHelper、MathNet.Numerics、OxyPlot.Core、OxyPlot.WindowsForms
public partial class Form1 : Form
{
    double[] xAxis = new double[0];
    double[][] yAxis = new double[0][];
    double[] xAxis2 = new double[0];
    double[][] yAxis2 = new double[0][];
    public Form1()
    {
        InitializeComponent();

        var datas = ReadCsvWithCsvHelper("clean_data_row.csv");
        CalcFFT(datas);
        DrawPlot();
    }
    OxyColor[] colors =
    [
        OxyColors.Blue,
        OxyColors.Yellow,
        OxyColors.Red,
        OxyColors.Green,
        OxyColors.Pink,
        OxyColors.Black,
        OxyColors.Orange,
    ];
    public List<double[]> ReadCsvWithCsvHelper(string filePath)
    {
        using (var reader = new StreamReader(filePath))
        using (var csv = new CsvReader(reader, CultureInfo.InvariantCulture))
        {
            var result = new List<double[]>();
            // 如果你的CSV文件有标题行,可以调用ReadHeader来读取它们
            csv.Read();
            csv.ReadHeader();
            while (csv.Read())
            {
                result.Add([
                    csv.GetField<double>(0),
                    csv.GetField<double>(1),
                    csv.GetField<double>(2),
                ]);
            }
            return result;
        }
    }

    public void CalcFFT(List<double[]> datas)
    {
        var first = datas.First();
        yAxis = new double[first.Length][];
        yAxis2 = new double[first.Length][];
        for (int i = 0; i < first.Length; i++)
        {
            // 将数据转换为Complex32数组以便进行傅里叶变换
            Complex32[] dataComplex = datas.Select(item => new Complex32((float)item[i], 0)).ToArray();

            // 进行傅里叶变换
            Fourier.Forward(dataComplex, FourierOptions.AsymmetricScaling);

            var len = dataComplex.Length;
            // 计算频率
            double[] frequencies = Fourier.FrequencyScale(len, 1);

            xAxis = frequencies;
            yAxis[i] = dataComplex.Select(x => Math.Abs(Math.Round(x.Magnitude, 7))).ToArray();

            xAxis2 = frequencies.Take(len / 2).ToArray();
            yAxis2[i] = dataComplex.Select(x => Math.Abs(Math.Round((x.Magnitude * x.Magnitude / len), 7))).Take(len / 2).ToArray();
        }

    }

    public void DrawPlot()
    {
        // 绘制频谱图和功率谱密度图(这里使用OxyPlot库)
        var plotModel = new PlotModel { Title = "Spectrum Analysis" };

        // 频谱图
        int xAxisLength = xAxis.Length;
        int yAxisLength = yAxis.Length;

        for (int i = 0; i < yAxisLength; i++)
        {
            var frequencySeries = new LineSeries
            {
                Title = "Item" + (i + 1),
                MarkerType = MarkerType.None,
                Color = colors[i]
            };
            for (int j = 0; j < xAxisLength; j++)
            {
                frequencySeries.Points.Add(new DataPoint(xAxis[j], yAxis[i][j]));
            }
            plotModel.Series.Add(frequencySeries);
        }
        plotModel.Axes.Add(new LinearAxis { Position = AxisPosition.Bottom, Title = "Frequency (Hz)" });
        plotModel.Axes.Add(new LinearAxis { Position = AxisPosition.Left, Title = "Amplitude" });
        this.plotView1.Model = plotModel;

        var plotModel2 = new PlotModel { Title = "Power Spectrum Density" };

        // 功率谱密度图
        int xAxis2Length = xAxis2.Length;
        int yAxis2Length = yAxis2.Length;

        for (int i = 0; i < yAxis2Length; i++)
        {
            var powerSeries = new LineSeries
            {
                Title = "Item" + (i + 1),
                MarkerType = MarkerType.None,
                Color = colors[i]
            };
            for (int j = 0; j < xAxis2Length; j++)
            {
                powerSeries.Points.Add(new DataPoint(xAxis2[j], yAxis2[i][j]));
            }
            plotModel2.Series.Add(powerSeries);
        }

        plotModel2.Axes.Add(new LinearAxis { Position = AxisPosition.Bottom, Title = "Frequency (Hz)" });
        plotModel2.Axes.Add(new LinearAxis { Position = AxisPosition.Right, Title = "Power" });
        this.plotView2.Model = plotModel2;
    }
}
源代码:https://gitee.com/Karl_Albright/csharp-demo/tree/master/PythonnetDemo/PythonnetFFTWinFormsApp

 浙公网安备 33010602011771号