
Matplotlib legend参数详解
Matplotlib legend参数详解
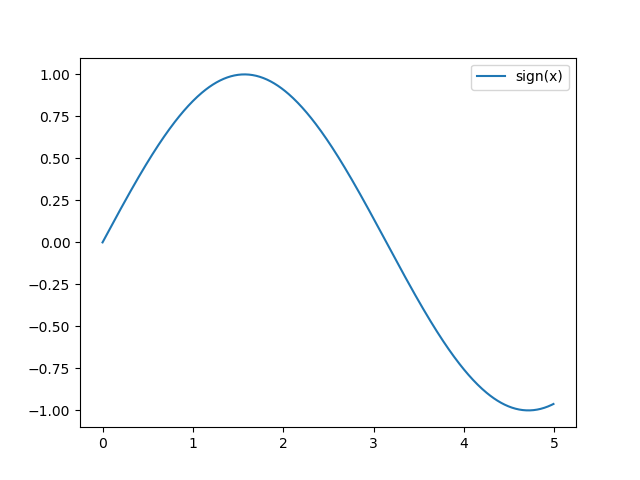
legend在画图中用于设置生成图例,只需要在代码中添加plt.legend()则会自动根据前面画图中的label绘制图例,如下图所示:
import math

import matplotlib.pyplot as plt
import numpy as np

x = np.arange(0, 5, 0.01)
y = [math.sin(i) for i in x]

plt.plot(x, y, label="sign(x)")

plt.legend()

plt.show()
图例有许多参数可供调整,在官方文档中列举了plt.legend的一系列参数设置,这里简要摘出来一些常用的参数和配置进行介绍:
图例位置
图例显示最主要的调整即为位置,如果选择显示图例在画图区域内部,则可以配置loc参数
| 字符表示 | 代号 |
|---|---|
| 'best' | 0 |
| 'upper right' | 1 |
| 'upper left' | 2 |
| 'lower left' | 3 |
| 'lower right' | 4 |
| 'right' | 5 |
| 'center left' | 6 |
| 'center right' | 7 |
| 'lower center' | 8 |
| 'upper center' | 9 |
| 'center' | 10 |
import math

import matplotlib.pyplot as plt
import numpy as np

x = np.arange(0, 5, 0.01)
y = [math.sin(i) for i in x]

labelList = ['best', 'upper right', 'upper left', 'lower left', 'lower right', 'right', 'center left', 'center right', 'lower center', 'upper center', 'center']


plt.figure(figsize=(12, 12))
for i in range(11):
    plt.subplot(4, 3, i+1)
    plt.plot(x, y, label=labelList[i])
    plt.legend(loc=i)

plt.show()
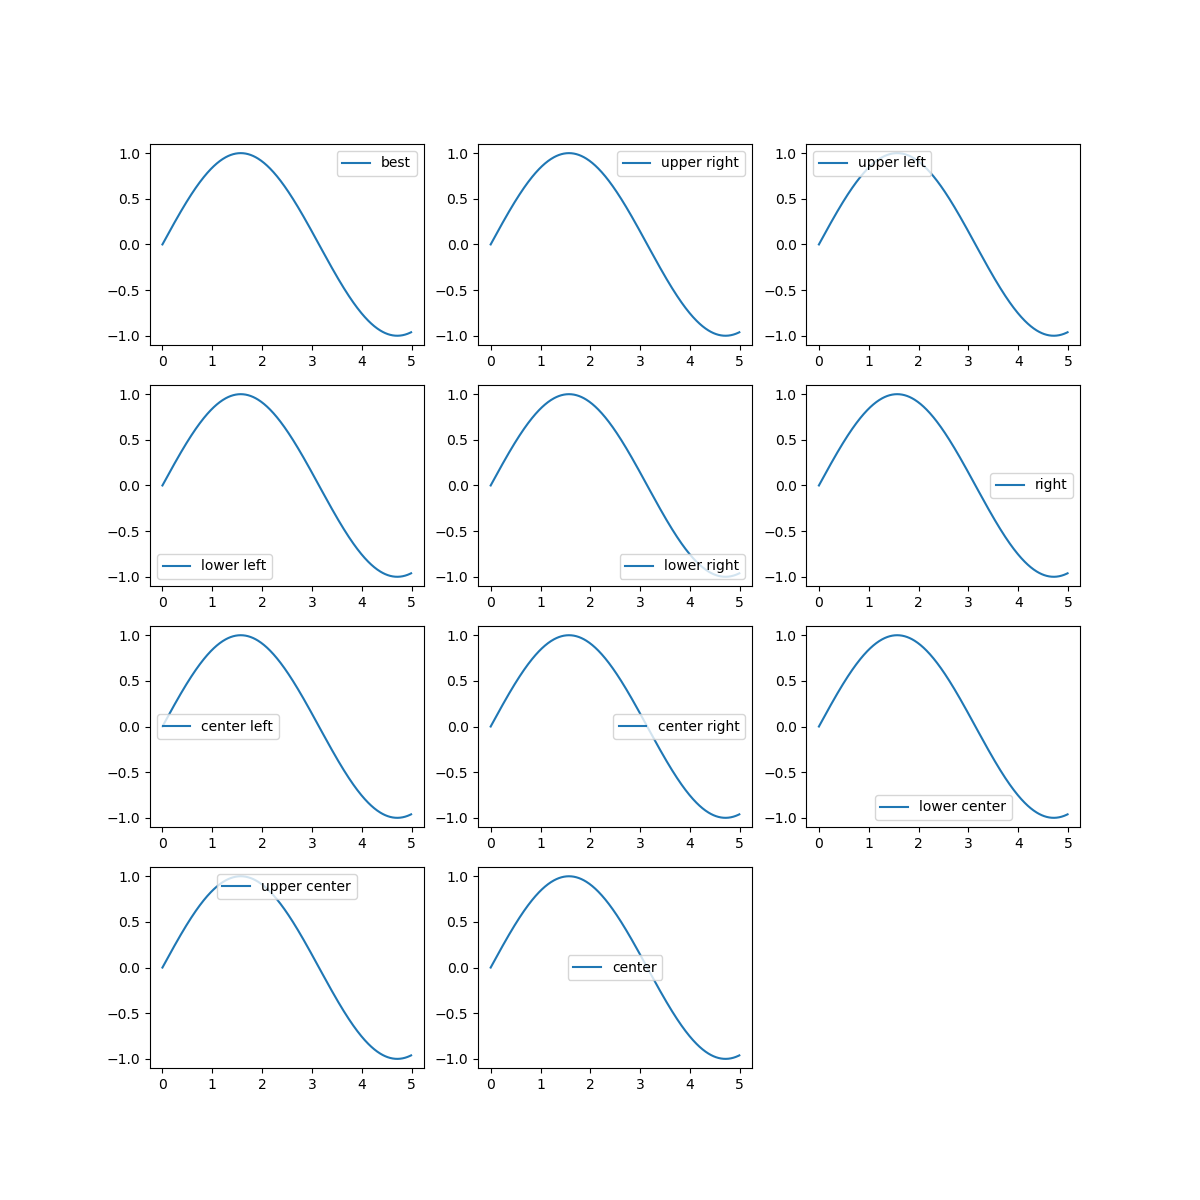
位置标注如上,一般选择loc=0,会自动调整最佳的位置放置图例,如果挡住重要的数据点,则可以通过plt.xlim和plt.ylim调整坐标轴大小,调整数据点位置。
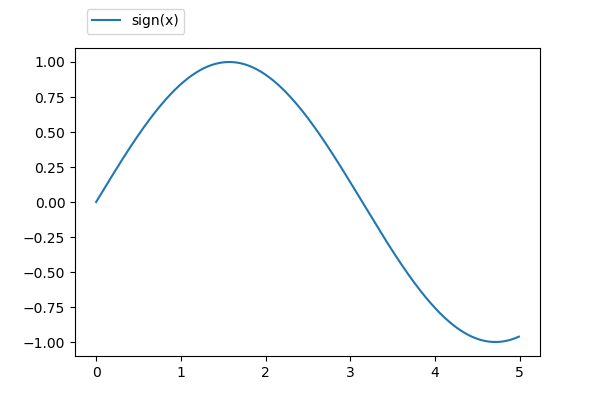
此外,对于需要将图例放置在图外的情况,可以设置bbox_to_anchor,通过手动调节的方式设置图例位置,如下图所示:
import math
import matplotlib.pyplot as plt
import numpy as np

x = np.arange(0, 5, 0.01)
y = [math.sin(i) for i in x]


plt.figure(figsize=(6, 4))
plt.plot(x, y, label="sign(x)")

plt.legend(loc=0, bbox_to_anchor=(0.25, 1.15))

plt.show()
图例大小
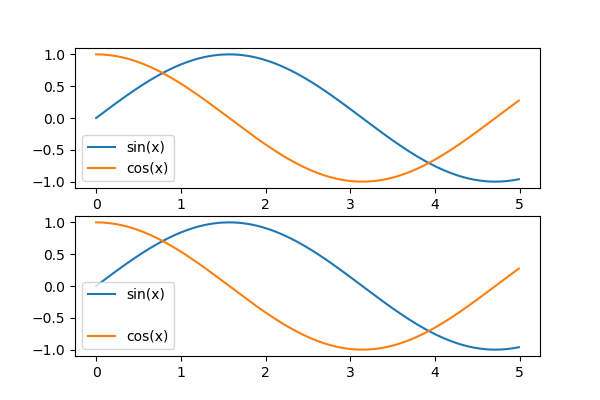
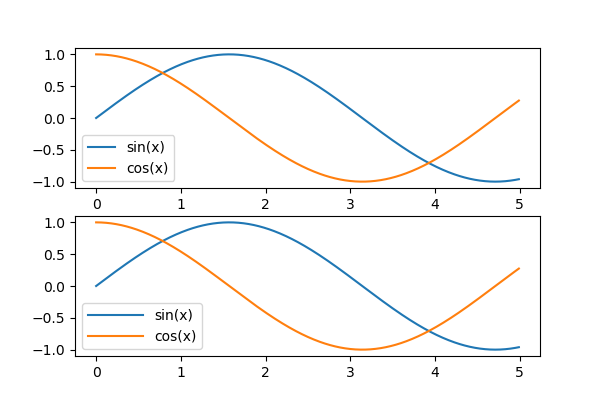
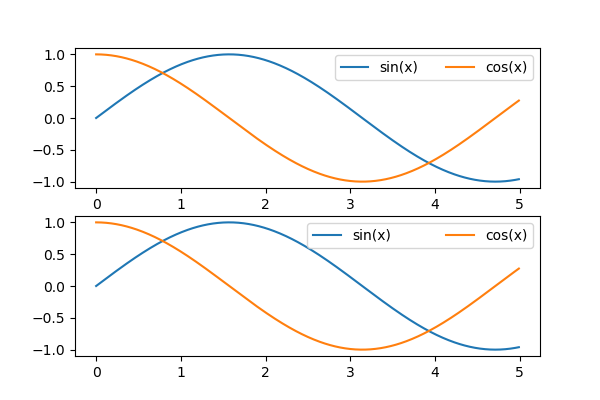
labelspacing(default: 0.5):上下图例之间的距离
plt.subplot(2, 1, 1)
plt.plot(x, y1, label="sin(x)")
plt.plot(x, y2, label="cos(x)")
plt.legend(loc=0, labelspacing=0.5)

plt.subplot(2, 1, 2)
plt.plot(x, y1, label="sin(x)")
plt.plot(x, y2, label="cos(x)")
plt.legend(loc=0, labelspacing=2)
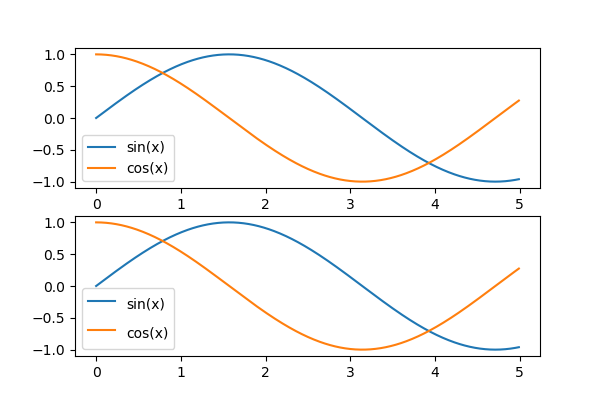
handlelength(default: 2.0):图例左侧图像的宽度
plt.subplot(2, 1, 1)
plt.plot(x, y1, label="sin(x)")
plt.plot(x, y2, label="cos(x)")
plt.legend(loc=0, handlelength=2)

plt.subplot(2, 1, 2)
plt.plot(x, y1, label="sin(x)")
plt.plot(x, y2, label="cos(x)")
plt.legend(loc=0, handlelength=4)
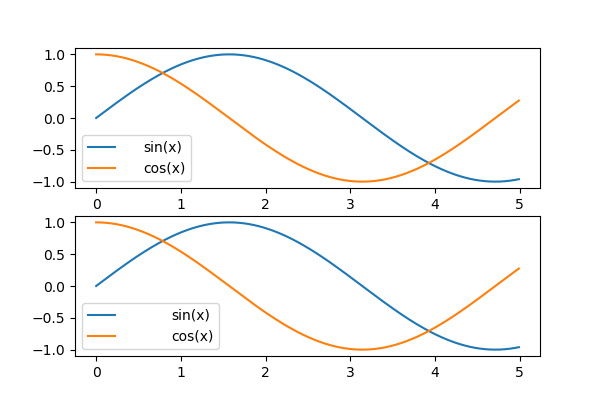
handleheight(default: 0.7):图例左侧图像的高度
plt.subplot(2, 1, 1)
plt.plot(x, y1, label="sin(x)")
plt.plot(x, y2, label="cos(x)")
plt.legend(loc=0, handleheight=0.7)

plt.subplot(2, 1, 2)
plt.plot(x, y1, label="sin(x)")
plt.plot(x, y2, label="cos(x)")
plt.legend(loc=0, handleheight=2)
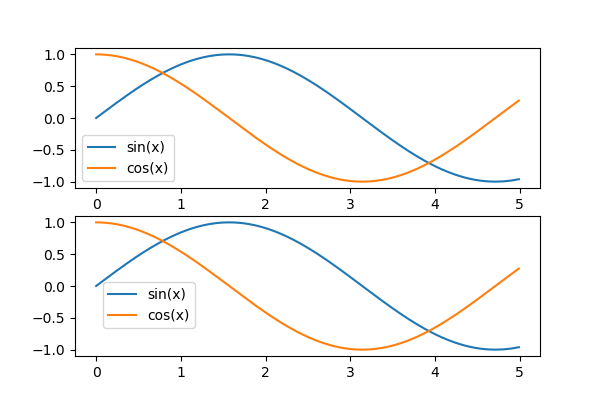
handletextpad(default: 0.8):左侧图例和右侧文字之间的距离
plt.subplot(2, 1, 1)
plt.plot(x, y1, label="sin(x)")
plt.plot(x, y2, label="cos(x)")
plt.legend(loc=0, handletextpad=2)

plt.subplot(2, 1, 2)
plt.plot(x, y1, label="sin(x)")
plt.plot(x, y2, label="cos(x)")
plt.legend(loc=0, handletextpad=4)
borderaxespad(default: 0.5):图例和坐标轴之间的边距
plt.subplot(2, 1, 1)
plt.plot(x, y1, label="sin(x)")
plt.plot(x, y2, label="cos(x)")
plt.legend(loc=0, borderaxespad=0.5)

plt.subplot(2, 1, 2)
plt.plot(x, y1, label="sin(x)")
plt.plot(x, y2, label="cos(x)")
plt.legend(loc=0, borderaxespad=2)
columnspacing(default: 2.0):两个横向图例间的距离,这里设置ncol=2即标明图例按照两列进行排列
plt.subplot(2, 1, 1)
plt.plot(x, y1, label="sin(x)")
plt.plot(x, y2, label="cos(x)")
plt.legend(loc=0, ncol=2, columnspacing=2)

plt.subplot(2, 1, 2)
plt.plot(x, y1, label="sin(x)")
plt.plot(x, y2, label="cos(x)")
plt.legend(loc=0, ncol=2, columnspacing=4)

 浙公网安备 33010602011771号