Python数据可视化--matplotlib
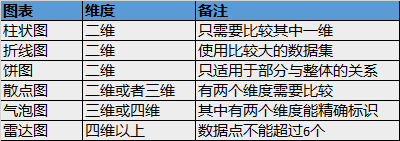
抽象化|具体化: 如盒形图 | 现实中的图
功能性|装饰性:没有装饰和渲染 | 包含艺术性美学上的装饰
深度表达|浅度表达:深入层次的研究探索数据 | 易于理解的,直观的表示
多维度|单一维度:数据的多个层次 | 数据的单一维度
创造性|熟悉性:全新的方式进行可视化 | 被大众接受并且熟悉的方式
新颖性|冗余性: 每个元素只表述一次 | 每个元素表示多次
Matplotlib:
- Backend层
- 用于处理向屏幕或文件渲染图形
- Artist层
- 包含图像绘制的容器:Figure, Subplot 及Axes。
- 包含基本元素,如: Line2D,Rectange等。
- Scripting层
- 简化访问Artist和Backend层的过程
pyplot
https://matplotlib.org/users/pyplot_tutorial.html
- pyplot可通过gcf(get current figure)获取当前图像对象,gca(get current axis)获取当前坐标轴对象
- pyplot只是对axes对象的调用做了“镜像”,可以通过pyplot.plot()进行绘图,其底层调用的还是axes.plot() 函数
散点图
- plt.scatter()
- plt.xlabel()
- plt.ylabel()
- plt.title()
- plt.legend()
- 线性,标记,颜色ax.plot(x,y,'r--') == ax.plot(x,y,linestyle='--',color='r')
线图:
- plt.plot()
- plt.gca().fill_between() 填充线间的区域
- np.array()生成时间数据
- 如果坐标轴是以时间的,可以借助pandas 的to_datetime()
- plt.xticks(rotation=) 或者遍历ticks进行set_rotation()
- plt.subplots_adjust().调整边界距离
柱状图
- plt.bar()
- group bar chart 当同一个图包含多个柱状图是,要对x轴相对做平移,避免柱状图的重叠
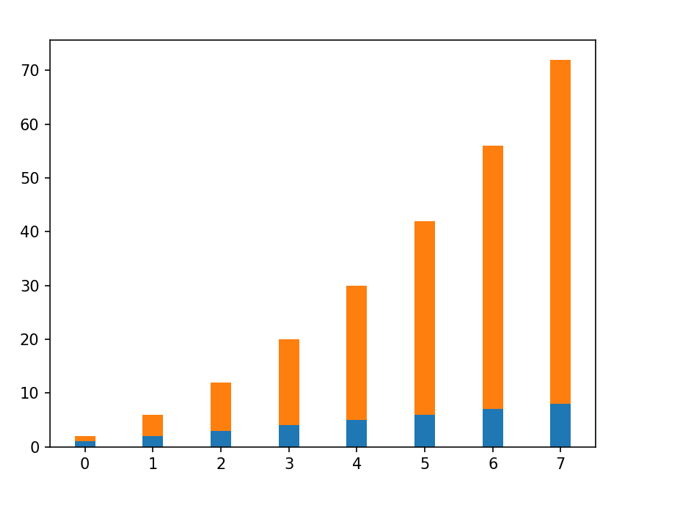
- stack bar chart 用bottom参数
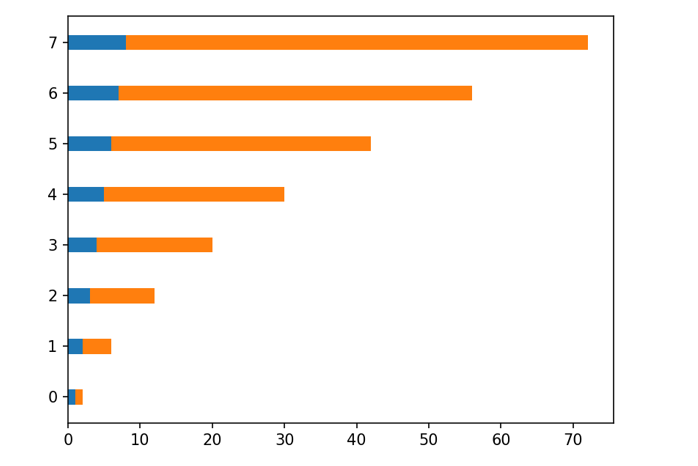
- 横向柱状图:barh, width = height; bottom = left
适用场景
1. Matplotlib
import matplotlib as mpl
mpl.get_backend()
2. 简单绘图,
import matplotlib.pyplot as plt
plt.plot(3, 2)
plt.show()
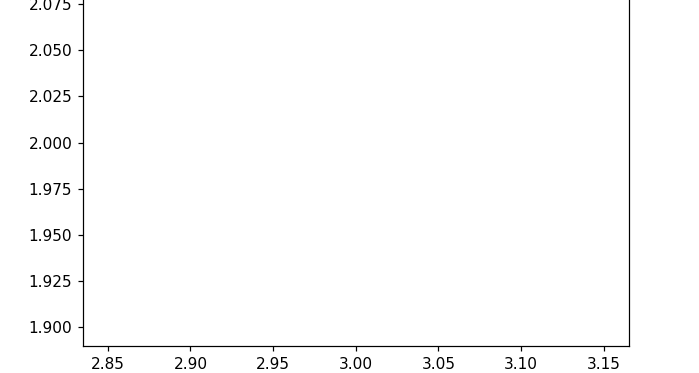
上图看不到任何的点。
plt.plot(3, 2, '*')
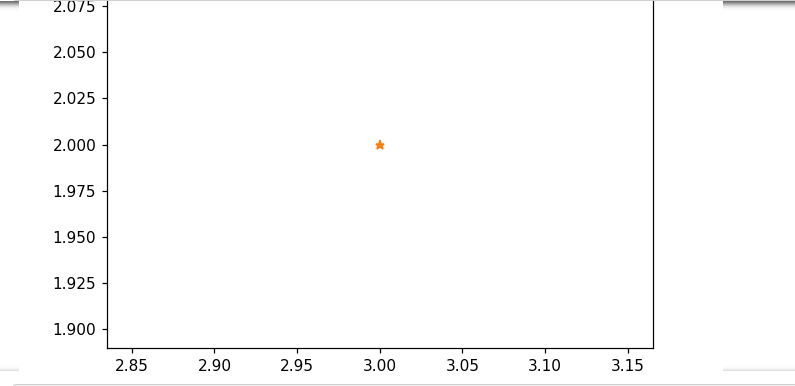
使用scipting 层
from matplotlib.backends.backend_agg import FigureCanvasAgg
from matplotlib.figure import Figure

fig = Figure()
canvas = FigureCanvasAgg(fig)

ax = fig.add_subplot(111)
ax.plot(3, 2, '.')
canvas.print_png('test.png')
gca 获取当前坐标轴对象
plt.figure()
plt.plot(3, 2, 'o')
ax = plt.gca()
# 设置坐标轴范围
ax.axis([0, 6, 0, 10])
# matplot 会自动用颜色区分不同的数据
plt.figure()
plt.plot(1.5, 1.5, 'o')
plt.plot(2, 2, '*')
plt.plot(2.5, 2.5, '*')
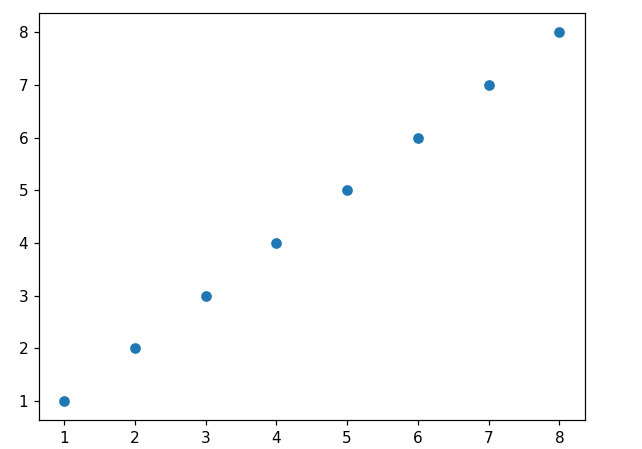
3. 散点图
import numpy as np
x = np.array([1, 2, 3, 4, 5, 6, 7, 8])
y = x

plt.figure()
plt.scatter(x, y)
import matplotlib as mpl
import matplotlib.pyplot as plt
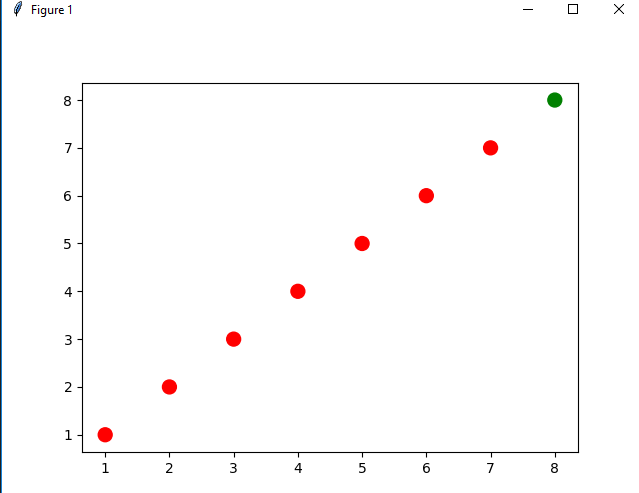
# 改变颜色及大小

import numpy as np
x = np.array([1, 2, 3, 4, 5, 6, 7, 8])
y = x
colors = ['red'] * (len(x) - 1)
colors.append('green')

plt.figure()
plt.scatter(x, y, s=100, c=colors)
plt.show()
# 使用zip合并两个列表为一个新列表
# 新列表中的每个元素为对应位置上的元组
l1 = list(range(1, 6))
l2 = list(range(6, 11))
zip_generator = zip(l1, l2)
tuple_list = list(zip_generator)
print(type(zip_generator))
print(list(tuple_list))

<class 'zip'>
[(1, 6), (2, 7), (3, 8), (4, 9), (5, 10)]
# 使用*进行对元组列表解包
x, y = zip(*tuple_list)
print(x)
print(y)
plt.figure()
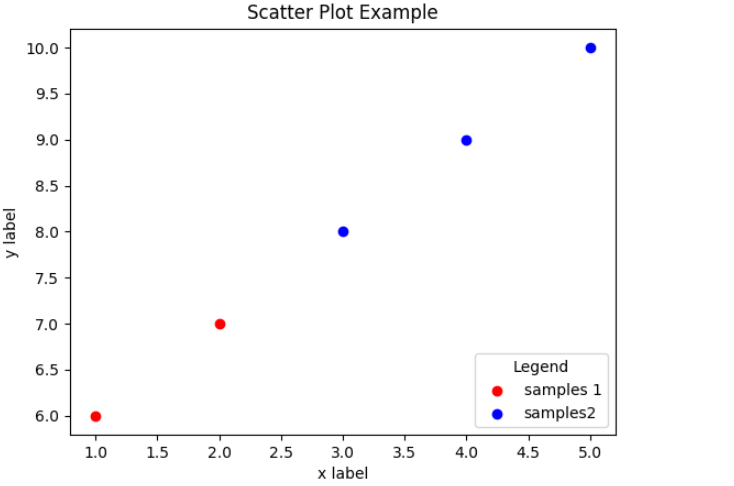
plt.scatter(x[:2], y[:2], c='red', label='samples 1')
plt.scatter(x[2:], y[2:], c='blue', label='samples2')
4. 线图
import numpy as np

linear_data = np.arange(1, 9)
quadratic_data = linear_data ** 2

plt.figure()
plt.plot(linear_data, '-o', quadratic_data, '-o')

# 注意,这里我们只指定了y轴数据,x轴的数据是matplotlib自动生成的
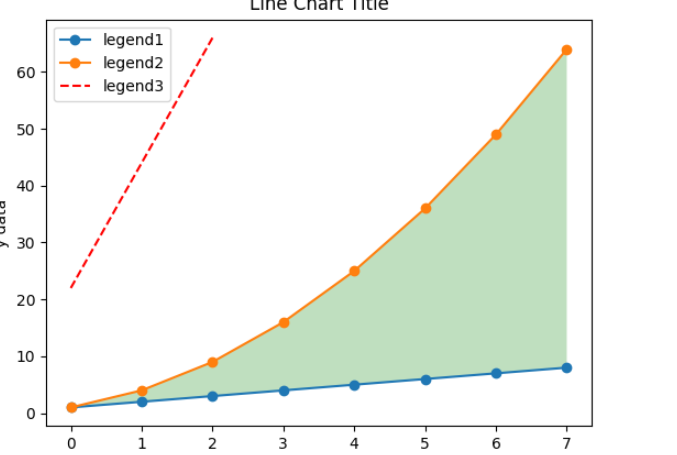
plt.plot([22, 44, 66], '--r')
# 添加坐标轴标签及图例
plt.xlabel('x data')
plt.ylabel('y data')
plt.title('Line Chart Title')
plt.legend(['legend1', 'legend2', 'legend3'])
# 填充两个line间的区域
plt.gca().fill_between(range(len(linear_data)),
                      linear_data, quadratic_data,
                      facecolor='green',
                      alpha=0.25)
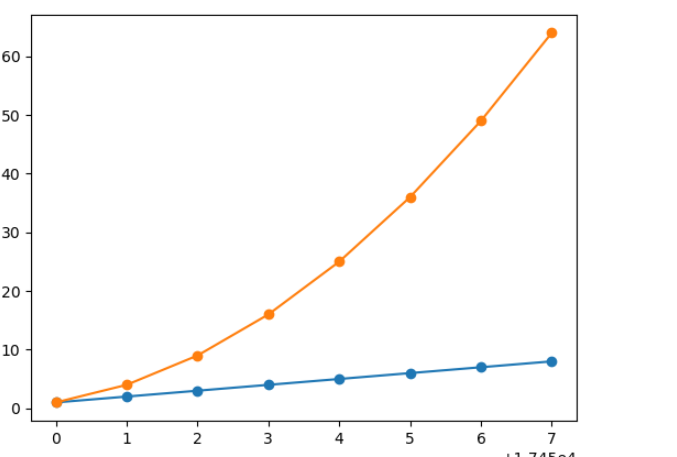
# 绘制横轴为时间的线图
plt.figure()
observation_dates = np.arange('2017-10-11', '2017-10-19', dtype='datetime64[D]')
observation_dates
plt.plot(observation_dates, linear_data, '-o',
        observation_dates, quadratic_data, '-o')
# 横轴并不是我们想要的结果
# 借助pandas绘制横轴为时间的线图
import pandas as pd
plt.figure()
observation_dates = np.arange('2017-10-11', '2017-10-19', dtype='datetime64[D]')
observation_dates = list(map(pd.to_datetime, observation_dates))
plt.plot(observation_dates, linear_data, '-o',
        observation_dates, quadratic_data, '-o')
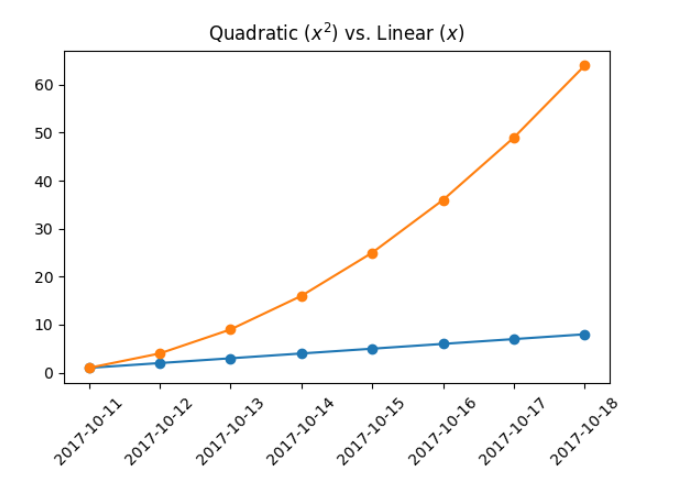
# plt.xticks(rotation='45')
x = plt.gca().xaxis
for item in x.get_ticklabels():
    item.set_rotation(45)
# 调整边界距离
plt.subplots_adjust(bottom=0.25)
# 对于学术制图,可在标题中包含latex语法
ax = plt.gca()
ax.set_title('Quadratic ($x^2$) vs. Linear ($x$)')
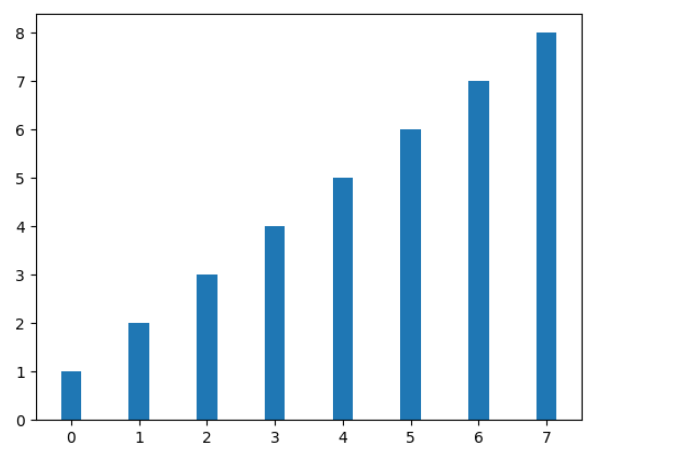
5. 柱状图
plt.figure()
x_vals = list(range(len(linear_data)))
plt.bar(x_vals, linear_data, width=0.3)
# group bar chart
# 同一副图中添加新的柱状图
# 注意,为了不覆盖第一个柱状图,需要对x轴做偏移
x_vals2 = [item + 0.3 for item in x_vals]
plt.bar(x_vals2, quadratic_data, width=0.3)

# stack bar chart
plt.figure()
x_vals = list(range(len(linear_data)))
plt.bar(x_vals, linear_data, width=0.3)
plt.bar(x_vals, quadratic_data, width=0.3, bottom=linear_data)
# 横向柱状图
plt.figure()
x_vals = list(range(len(linear_data)))
plt.barh(x_vals, linear_data, height=0.3)
plt.barh(x_vals, quadratic_data, height=0.3, left=linear_data)
4. 直方图
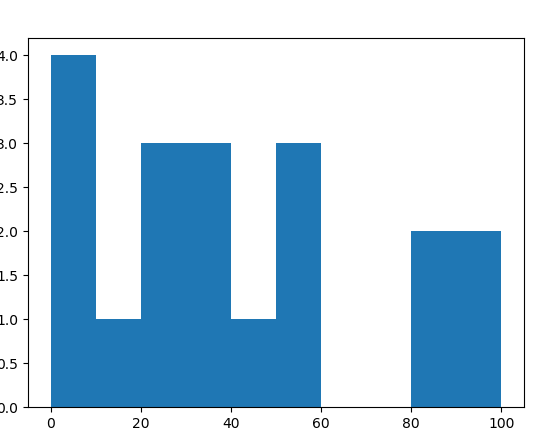
- 直方图是对数据分布情况的图形表示
- 首先对数据进行分组,然后统计每个分组内数据的数量
- 显示每个分组频率或者数量分布;易于显示各组之间频率或者数量的差别
- plt.hist(data,bins): data数据集合,bins分组边界和分组个数
import matplotlib as mpl
import matplotlib.pyplot as plt

data = [50,20,33,51,99,31,5,6,4,5,89,12,56,43]
bins = [0,10,20,40,50,60,70,80,100]
plt.hist(data,bins)
plt.show()
盒形图(箱状图)
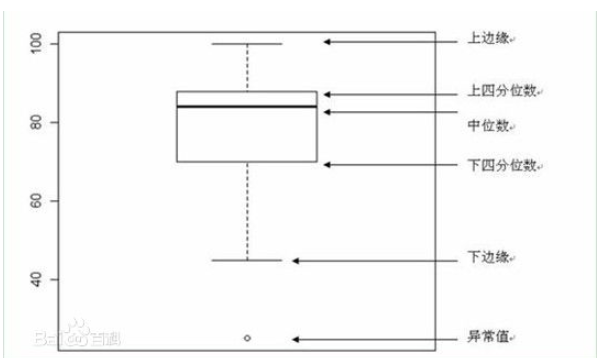
- 下边缘(Q1),表示最小值;
- 下四分位数(Q2),又称“第一四分位数”,等于该样本中所有数值由小到大排列后第25%的数字;
- 中位数(Q3),又称“第二四分位数”等于该样本中所有数值由小到大排列后第50%的数字;
- 上四分位数(Q4),又称“第三四分位数”等于该样本中所有数值由小到大排列后第75%的数字;
- 上边缘(Q5),表述最大值。
第三四分位数与第一四分位数的差距又称四分位间距。
功能:
- 箱型图有个功能就是可以检测这组数据是否存在异常值。异常值在哪里呢?就是在上边缘和下边缘的范围之外。
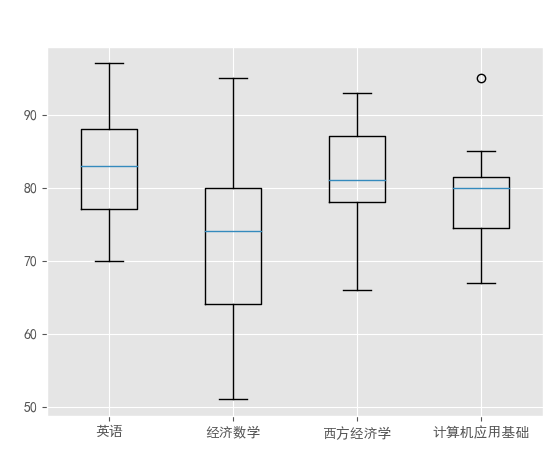
- 可以直接看出多组数据分布情况。
#首先导入基本的绘图包
import matplotlib.pyplot as plt
import numpy as np
import pandas as pd

#添加成绩表
plt.style.use("ggplot")
plt.rcParams['axes.unicode_minus'] = False
plt.rcParams['font.sans-serif']=['SimHei']

#新建一个空的DataFrame
df=pd.DataFrame()
 #添加成绩单,最后显示成绩单表格
df["英语"]=[76,90,97,71,70,93,86,83,78,85,81]
df["经济数学"]=[65,95,51,74,78,63,91,82,75,71,55]
df["西方经济学"]=[93,81,76,88,66,79,83,92,78,86,78]
df["计算机应用基础"]=[85,78,81,95,70,67,82,72,80,81,77]
print(df)
#用matplotlib来画出箱型图
plt.boxplot(x=df.values,labels=df.columns,whis=1.5)
plt.show()
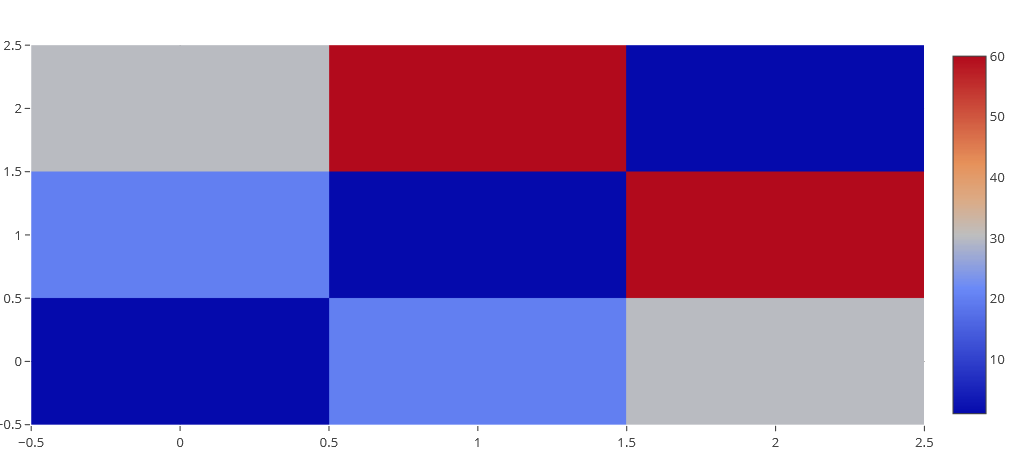
热图(heatmap):
- 可以用于三维以上的数据可视化
- plt.imshow(arr)
- plt.hist2d()
- plt.colorbar()添加颜色
import plotly
import plotly.plotly as py
import plotly.graph_objs as go

plotly.tools.set_credentials_file(username='Jessse_Li',api_key='your key')

trace = go.Heatmap(z=[[1, 20, 30],
                      [20, 1, 60],
                      [30, 60, 1]])
data=[trace]
py.iplot(data, filename='basic-heatmap')
Heatmap 加上标签信息
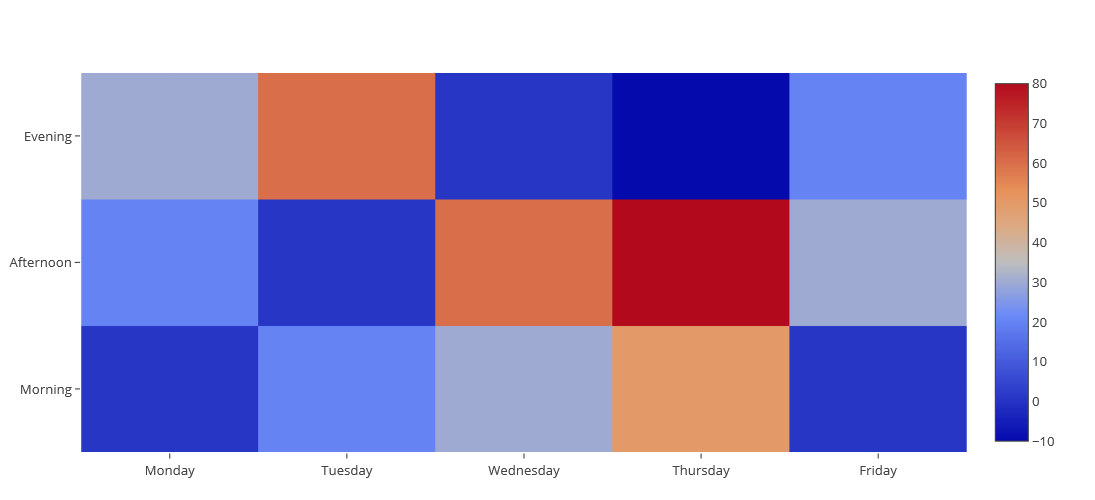
trace = go.Heatmap(z=[[1, 20, 30, 50, 1], [20, 1, 60, 80, 30], [30, 60, 1, -10, 20]],
                   x=['Monday', 'Tuesday', 'Wednesday', 'Thursday', 'Friday'],
                   y=['Morning', 'Afternoon', 'Evening'])
data=[trace]
py.iplot(data, filename='labelled-heatmap')
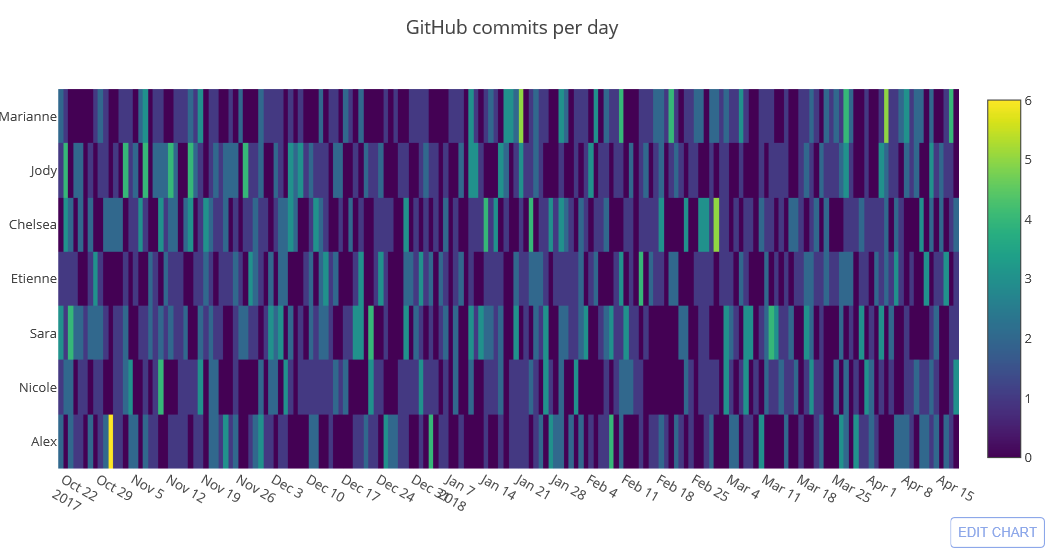
heatmap 加上时间序列
import datetime
import numpy as np
import plotly.plotly as py
import plotly.graph_objs as go

programmers = ['Alex','Nicole','Sara','Etienne','Chelsea','Jody','Marianne']

base = datetime.datetime.today()
date_list = [base - datetime.timedelta(days=x) for x in range(0, 180)]

z = []

for prgmr in programmers:
    new_row = []
    for date in date_list:
        new_row.append( np.random.poisson() )
    z.append(list(new_row))

data = [
    go.Heatmap(
        z=z,
        x=date_list,
        y=programmers,
        colorscale='Viridis',
    )
]

layout = go.Layout(
    title='GitHub commits per day',
    xaxis = dict(ticks='', nticks=36),
    yaxis = dict(ticks='' )
)

fig = go.Figure(data=data, layout=layout)
py.iplot(fig, filename='datetime-heatmap')
