
使用pandas处理数据并绘图的例子
import sys
import os
import re
import datetime
import csv


def get_datetime(record):
    request_time = ""
    p = re.compile(r"(?P<time>\d{4}-\d{2}-\d{2} \d{2}:\d{2}:\d{2},\d+)")
    # p = re.compile(r"(?P<time>[\d.]+)ms")
    m = p.search(record)
    if m:
        request_time = m.group("time")
    dt = datetime.datetime.strptime(request_time, '%Y-%m-%d %H:%M:%S,%f')
    return dt


def parse(log_file_name, result_csv_name):
    start = 0
    end = 0
    start_time = ''
    end_time = ''
    md5crc32 = ''
    csv_writer = csv.writer(open(result_csv_name, 'wb'),
                            delimiter = ',')
    with open(log_file_name, 'rb') as log_file:
        for i, line in enumerate(log_file):
            line = line.strip()
            if 'folderProcessing()  INFO download from' in line:
                start = i
                start_time = get_datetime(line)
            elif 'DownLoadFile()  INFO download to' in line:
                end = i
                end_time = get_datetime(line)
                # got one download action
                if end -  start == 1:
                    # parse hash
                    md5crc32 = line.rsplit('/', 1)[1]
                    print md5crc32, (end_time - start_time).total_seconds()
                    csv_writer.writerow((md5crc32, (end_time - start_time).total_seconds()))
                    # assert False

def do_statistics(file_name):
    import pandas as pd
    import numpy as np
    import matplotlib.pyplot as plt
    df = pd.read_csv(file_name, header = None, names= ['hash', 'time'], dtype = {'time': np.float64},
                    # nrows = 10000
                    )
    time_series = df.time
    print time_series.describe()
    plt.figure()
    # fig = time_series.hist().get_figure()
    # define range
    ranges = (0.0, 0.1, 0.2, 0.3, 0.4, 0.5, 0.6, 0.7, 0.8, 0.9, 1.0, 2.0, 3.0, 4.0, 10.0, 10000)
    bins = zip(ranges[:-1], ranges[1:])
    labels = ['%s-%s'%(begin, end) for i ,(begin, end) in enumerate(bins) ]
    print labels
    #print bins
    #fig = time_series.plot(kind='bar', xticks = ranges)
    results = [0] * len(bins)
    for i in time_series:
        for j , (begin, end) in enumerate(bins):
            if i > begin and i <= end:
                results[j] += 1
    print results

    mu = time_series.mean()
    median = np.median(time_series)
    sigma = time_series.std()

    ax = pd.Series(results).plot(kind='bar', logy = True, figsize=(25, 13.5))
    # dpi = ax.figure.get_dpi()
    # print 'dpi = ', dpi
    # plt.gcf().set_size_inches(25, 13.5)

    ax.set_ylabel('Count')
    ax.set_xlabel('Time in seconds')
    # print dir(fig)
    ax.set_xticklabels(labels, rotation = 45)
    ax.set_title('MDSS download statistics')

    textstr = 'count=%s\nmin=%.2f\nmax=%.2f\n$\mu=%.2f$\n$\mathrm{median}=%.2f$\n$\sigma=%.2f$'%(time_series.count(),time_series.min(), time_series.max(),mu, median, sigma)

    # these are matplotlib.patch.Patch properties
    props = dict(boxstyle='round', facecolor='wheat', alpha=0.5)

    # place a text box in upper right in axes coords
    ax.text(0.90, 0.95, textstr, transform=ax.transAxes, fontsize=14,
            verticalalignment='top', bbox=props)

    ax.figure.show()
    #
    ax.figure.set_size_inches(25, 13.5, forward = True)
    print ax.figure.get_size_inches()
    ax.figure.savefig('result.png', format='png',)
    input('asdfasd')


if __name__ == "__main__":
   # print  get_datetime("2014-10-23 09:19:34,251 pid=27850")
   # parse('inpri_p_antiy.log', 'result.csv')
   do_statistics('result.csv')
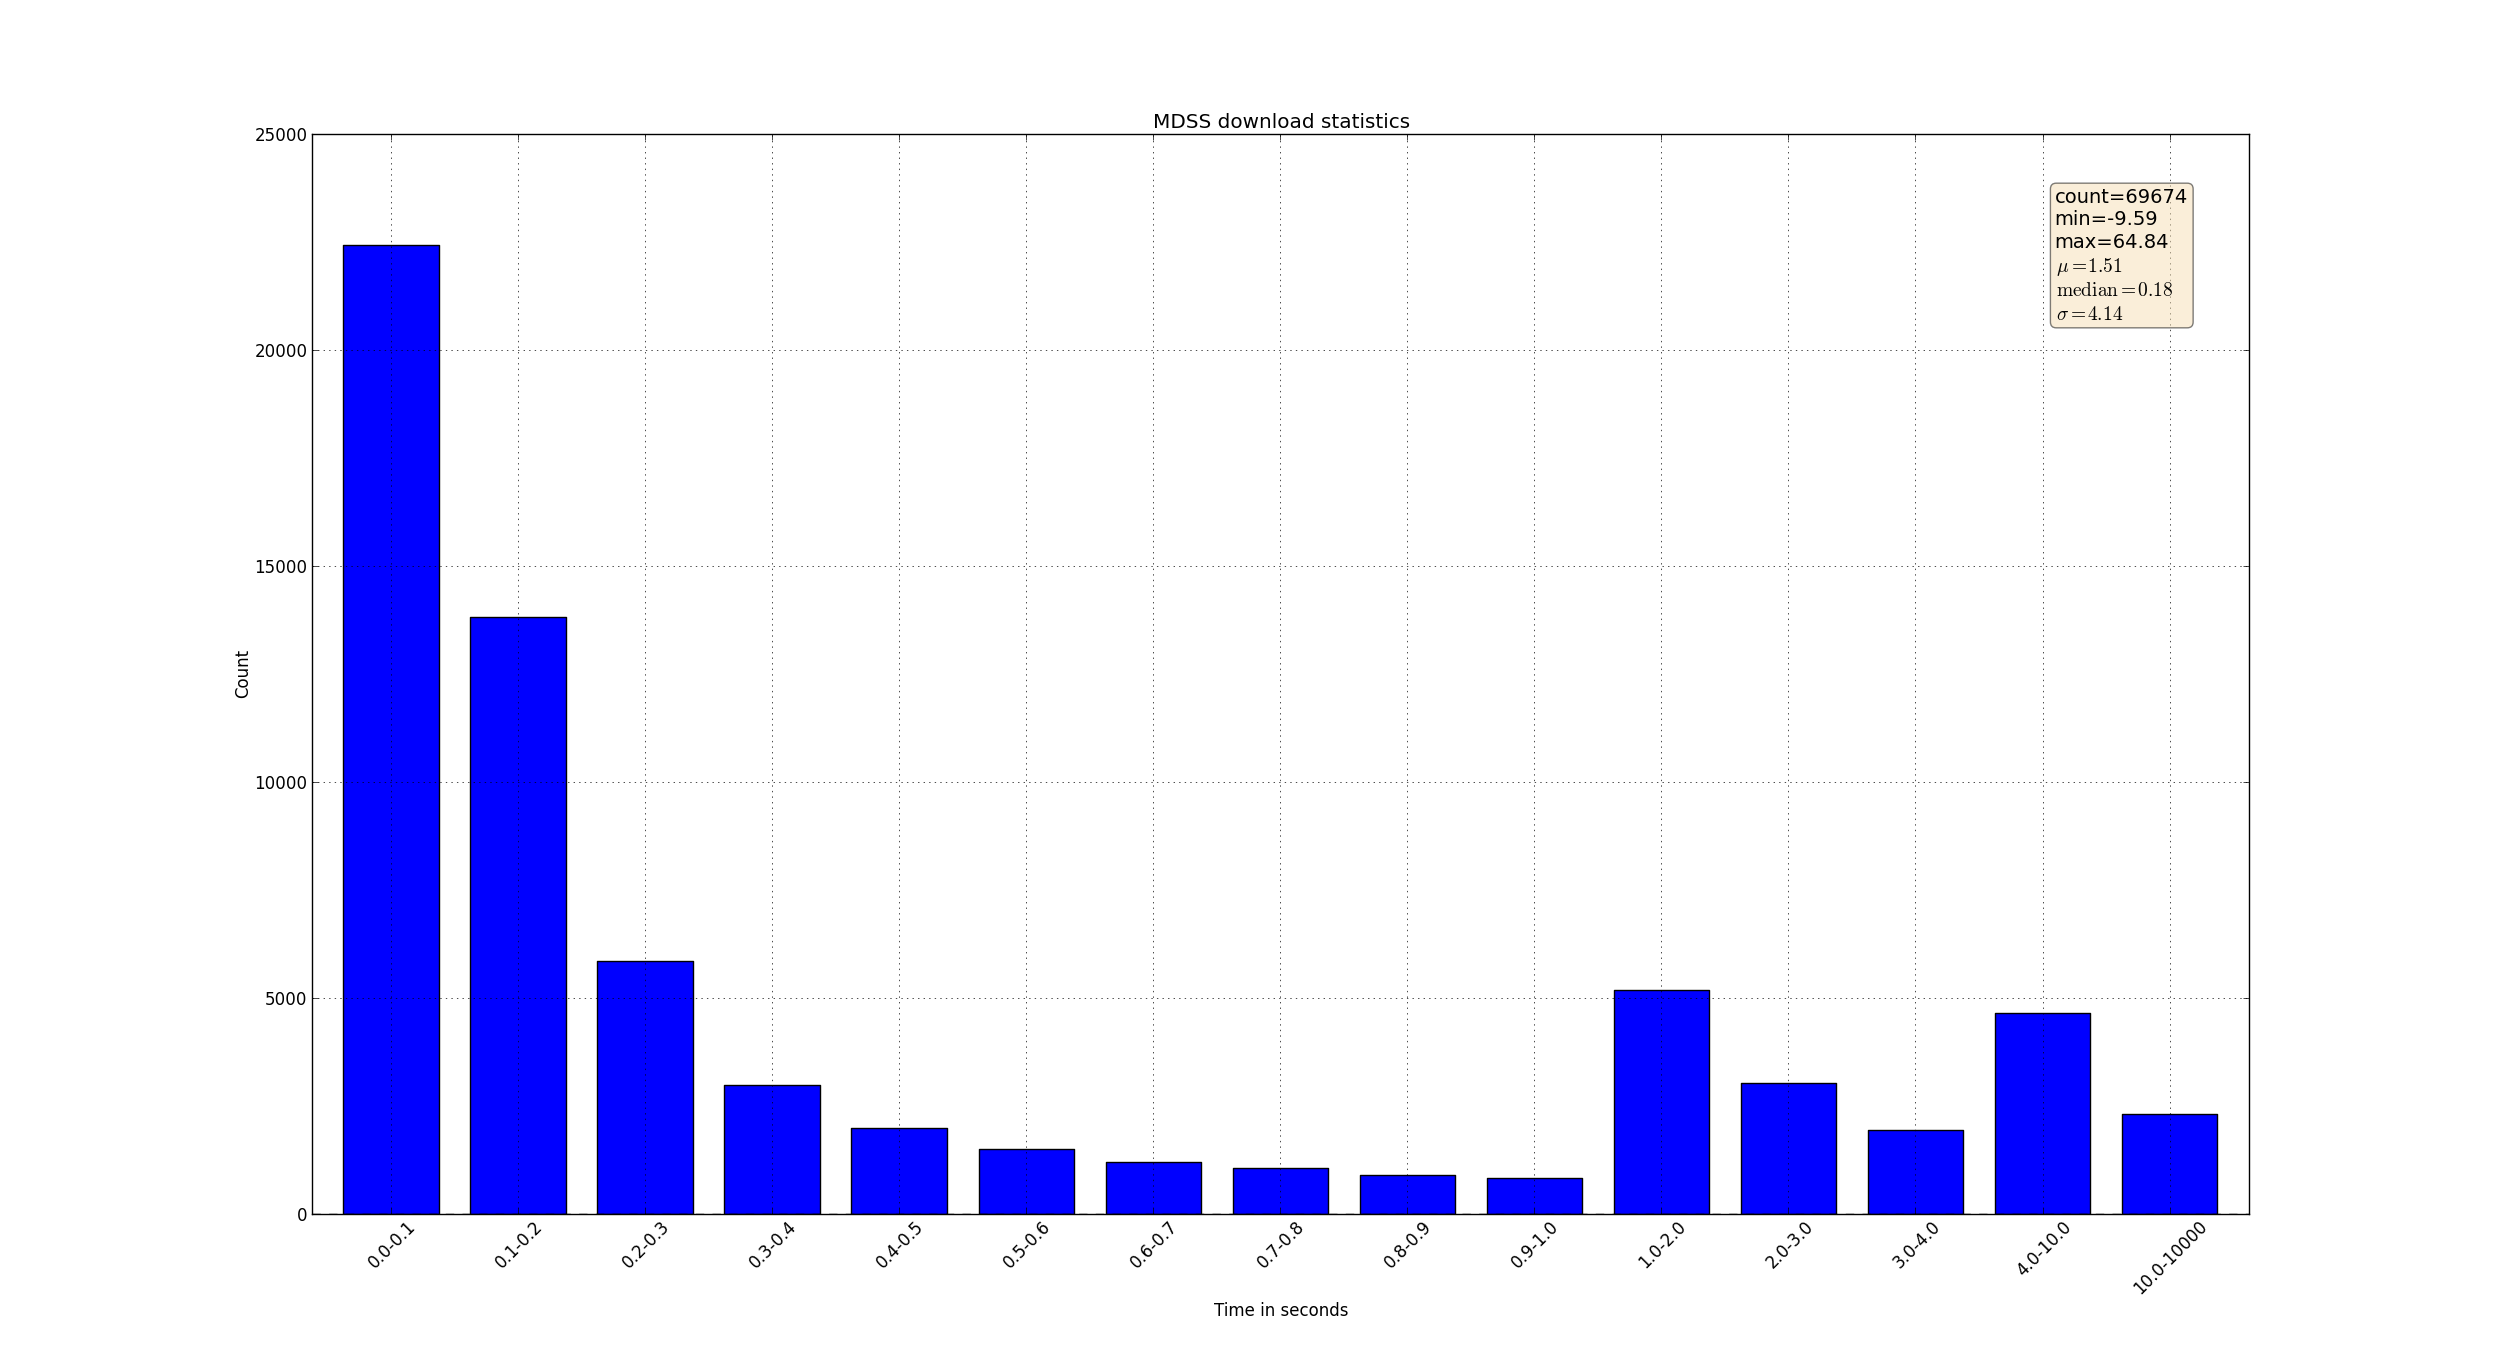
生成图像如下:

 浙公网安备 33010602011771号