echarts使用技巧记录
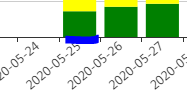
显示数值以及对数值进行显示转换 折线的颜色
series: [
{
name: '排配總數',
type: 'line',
yAxisIndex: 1,
data: array3,
itemStyle: {
normal: {
label: {
formatter: function (val) {//标签转换
return val.value + "%";
},
show: true,
fontSize: 10//标签字体大小
},
lineStyle: {
color: 'blue'//折线颜色
}
}
}
},
指定 legend颜色
一般情况下,legend颜色与bar或line的颜色是一样的,不过当你指定bar或line的颜色的时候,legend的颜色还是默认的
在legend同级添加 color: ['blue', 'green'],
两个Y轴显示

let option = {
tooltip: {
trigger: 'xAxisaxis'
},
grid: {
right: '10%'
},
legend: {
data: ['排配總數', '累計達成數','每節課達成數']
},
color: ['blue', 'green'],
xAxis: [
{
type: 'category',
data: ['第一節', '第二節', '第三節', '第四節', '第五節', '第六節', '第七節', '第八節', '第九節', '第十節', '第十一節', '第十二節']
}
],
yAxis: [
{
type: 'value',
name: '每節達成數',
position: 'left',
axisLine: {
lineStyle: {
color: 'orange'
}
}
},
{
type: 'value',
name: '排配達成數',
max: ymax,
min:0,
position: 'right',
axisLine: {
lineStyle: {
color: 'blue'
}
}
}
],
series: [
{
name: '排配總數',
type: 'line',
yAxisIndex: 1,
data: array3,
itemStyle: {
normal: {
label: {
formatter: function (val) {
return val.value + "%";
},
show: true,
fontSize: 10
},
lineStyle: {
color: 'blue'
}
}
}
},
{
name: '累計達成數',
type: 'line',
yAxisIndex: 1,
data: array2,
itemStyle: {
normal: {
label: {
//show: true, formatter: function (val) {
// return val.value + "%";
//},
show: true,
fontSize: 10
},
lineStyle: {
color: 'green'
}
}
}
},
{
name: '每節課達成數',
type: 'bar',
yAxisIndex: 0,
data: array1,
itemStyle: {
normal: {
color: 'orange',
label:{show:true}
}
}
}
]
};
Y轴最大值显示
可以获取数据的最大值,然后等比例增加
ymax = (Math.ceil(Number(array2[11]) / 1000) + 1) * 1000;
yAxis: [ {
type: 'value',
name: '排配達成數',
max: ymax,
min:0,
position: 'right',
axisLine: {
lineStyle: {
color: 'blue'
}
}
}
],
X轴文字倾斜
xAxis: [
{
type: 'category',
data: xAisData,
axisLabel: {
interval: 0,
rotate: 40
},
axisTick: {
//alignWithLabel: true
}
}
],
数据显示在刻度中间
悬浮框的显示
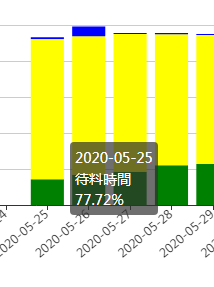
tooltip: {
axisPointer: { // 坐标轴指示器,坐标轴触发有效
type: 'shadow' // 默认为直线,可选为:'line' | 'shadow'
},
formatter : function(params, ticket, callback) {
console.log(params);
return params.name + '</br>' + params.seriesName + '</br>' + ((params.value) + '%');
}
},
