Biology 05: Digestion and Enzymes

Part 2: Quantitative and Qualitative Data Collection
How Do You Relate Glucose, Weight Loss, and Carb Cutter?
As an intrepid reporter for the Broadside, you have been given the assignment of writing an exposé on a new fad on campus—the use of a weight-loss supplement called Carb Cutter. Carb Cutter is touted for its ability to block the normal digestion of starch.
Starch, a large carbohydrate, is normally broken down by the enzyme amylase into glucose molecules. Glucose is preferentially used by the body for energy instead of fat, thus hampering the process of weight loss. Carb Cutter contains an ingredient extracted from northern kidney beans (Phaselous vulgaris) that prevents the proper functioning of amylase. If amylase cannot work, starch cannot be digested into glucose, and therefore gets eliminated by your body.
How do enzymes work? Enzymes are proteins that catalyze chemical reactions in our bodies. Their amino acids fold to create small pockets with unique shapes, called “active sites.” Only molecules with the correct corresponding shape can fit into these active sites and take part in the reaction promoted by the enzymes. To speed up all of the different chemical reactions you need to live, your body produces over 5,000 different enzymes.
Methods for Detecting Starch
Qualitative data allow you to estimate relative values. Quantitative data allow you to measure specific values.
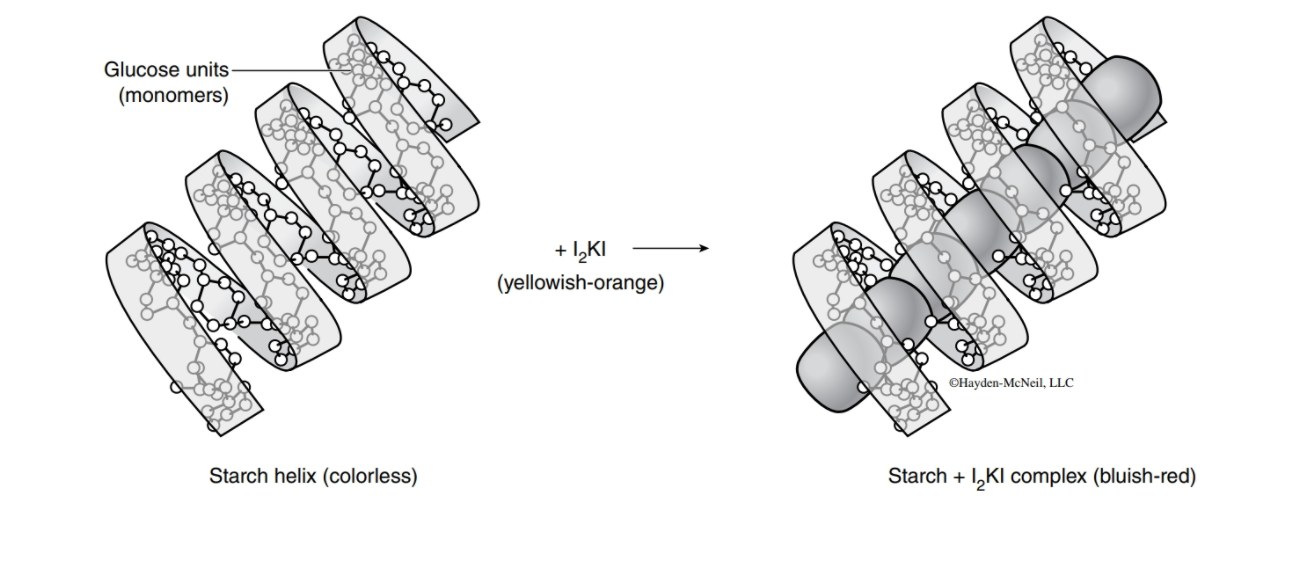
Qualitative methods: Iodine-potassium iodide (I2 potassium iodide (KI) and has a yellowish-orange color. If I2
KI) solution contains a mixture of iodine (I2 inserts into the middle of the helical
) and
structure of intact amylose (starch and glycogen) molecules, the solution changes to a bluish-red color. This color change does not occur with smaller carbohydrate fragments because they do not have the necessary helical structure.
Quantitative Methods:
Spectrophotometry A spectrophotometer is a machine that measures the amount of light absorbed by or transmitted through a solution. It accomplishes this by shining a beam of light from one side of the tube to a light detector on the other side. The detector measures how much light actually passed through the tube. If a lot of light is absorbed by the solution, then little light was transmitted through it to the detector. Inversely, if little light is absorbed, a lot of light was transmitted through. Here’s a graph of the relationship:
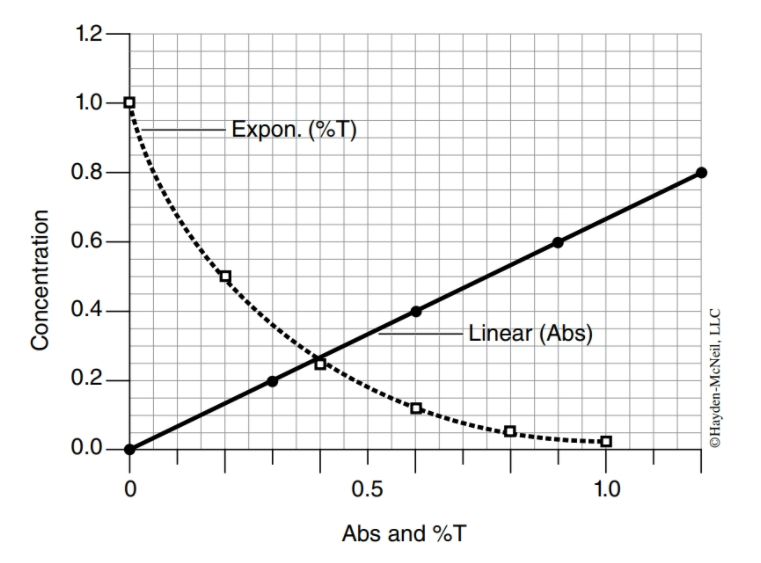
Absorbance readings are in numerical values of 0 to 2. Surprisingly, these values do not have units but instead are interpreted according to known standard curves.
Why is the spectrophotometer set to a particular wavelength (580 nm)?
An important part of using a spectrophotometer accurately is to set it at the appropriate wavelength (measured in nanometers, or nm). Every substance absorbs different wavelengths of light; all other light wavelengths either pass through the substance or bounce off the substance. Clear solutions absorb very little light, thus making it difficult to obtain absorbance measurements. In the Digestion and Enzymes lab, you will be working with clear starch solutions. As you just learned, when I2
KI binds
to starch it brings about a color change. Thus, adding this dye to your starch solutions will make it easier to obtain absorbance values. The solutions in this lab absorb at a wavelength of 580 nm. You will calibrate your spectrophotometer to read only your solution of interest by creating a “blank” tube. Your blank will contain volumes of all solutions in your experiment except your variable of interest.
Digestion and Enzymes Experiment
Objective 2: Use a quantitative method to determine whether starch is present in four solutions [A–D] and, if so, the absolute concentration of starch in these solutions.
Background
The results you obtained from the previous experiment are qualitative. They tell you which solutions have more/less starch than others but not much more than that. Often, it’s desirable to obtain more precise data—quantitative results. How would a spectrophotometer help you do this?
Please read the “Available Tools and Equipment” AND “Ideas to Consider” sections below. Using notes from your pre-lab assignment as a guide, discuss and agree upon an approach with your group to carry out your experiment. Fill out the Experimental Design Section on page 100 and show it to your GTA BEFORE you begin.
Available Tools and Equipment
• Four bottles, labeled A–D, each containing a starch solution of unknown concentration
• I2KI (0.1 to 0.3 ml is sufficient)
• Stock starch solution (concentration: 10 g/l)
• Syringes
• Spectrophotometer tubes and corks
• Test tube rack • Spectrophotometer
Ideas to Consider
• What information will the spectrophotometer tell you about your solutions?
• How does this information translate to absolute concentration values?
• Can you think of a way to relate absorbance values to corresponding starch concentrations using a standard curve that has been created with known values?
• You will need at least 4 ml of solution in your tubes for accuracy.
Objective 2:
Experimental Design and Results
Carry out your experiment and take notes below describing what you did and how your experiments helped you achieve Objective 2. Your descriptions should be clear and complete enough so that someone else can follow your logic and repeat your tests if necessary. Although you should discuss this as a group, your written work should be your own and will be graded as such by your GTA.
Graph paper is available to use on pages 111 and 113.
When you are done, please dump and wash test tube contents down the sink. Wash out your tubes and place back in test tube racks.

 浙公网安备 33010602011771号