

Pandas常用操作
Pandas是一个基于NumPy的库,为python提供了易用的数据结构和数据分析工具。
导入
import pandas as pd
Pandas数据结构
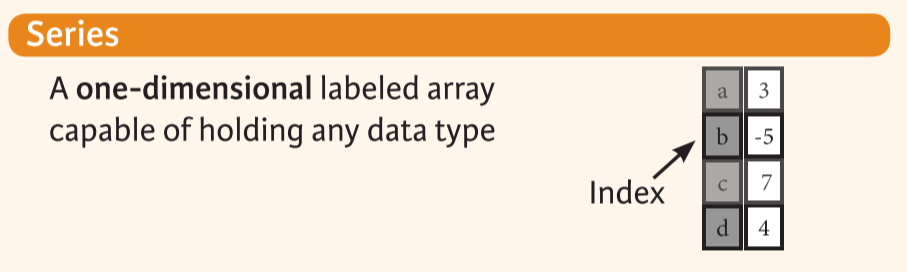
Series
一维的有标签的数组,可以容纳任何类型的数据。
# 创建
s = pd.Series([3,-5,7,4],index=['a','b','c','d'])

# 遍历
for i, v in s.items():

# 排序
s.sort_index()
s.sort_values(ascending=True)

# 替换数据
s.str.replace('正则表达式','',regex=True)

# 成列地访问时间数据
s.dt.hour

# 转化为列表
s.tolist()
s.index.tolist()
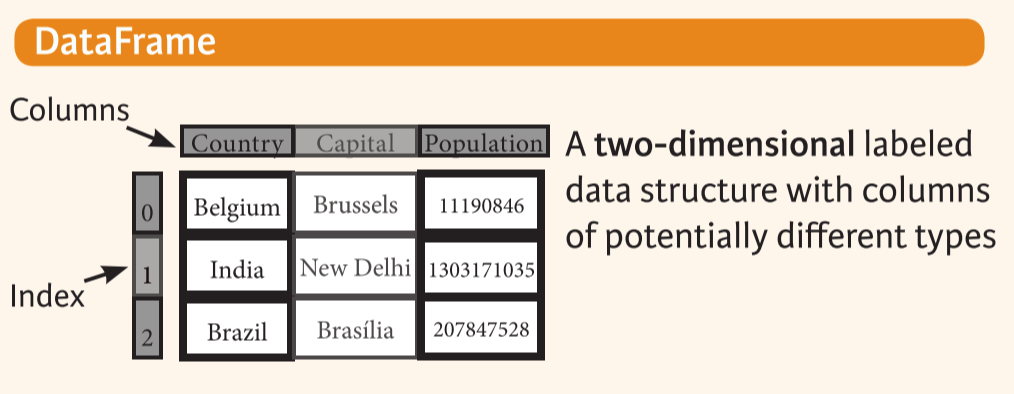
DataFrame
二维的有标签的数据结构,每一列都可能有不同的类型
# 创建pd.DataFrame的第一个参数必须是字典或列表
data = {'Country':['Belgium','India','Brazil'],
		'Capital':['Brussels','New Delhi','Brasilia'],
		'Population':[11190846,1303171035,207847528]}
df = pd.DataFrame(data,columns=['Country','Capital','Population'])

# 新增列
df['GDP'] = s

# 选取某些列
df[['Capital','Country']]

# 排序
df.sort_values(by="sales" , ascending=False)
筛选数据
布尔变量索引
# 获取Series中不大于1的数据
s[~(s>1)]]

# 获取Series中小于-1或大于2的数据
s[(s<-1)|(s>2)]

# 获取取值在某个列表内的数据
s.isin(l)

# 获取人数大于12000的数据
df[df['Population']>12000]
高级索引
# 查找符合条件的所有行
df.query()

# 选择符合条件的列
df.select_dtypes(include=['object']).copy()
丢弃数据
# 根据label丢弃Series中的数据
s.drop(['a','c'])

# 丢弃一列的数据
df.drop('Country',axis=1)

# 丢弃有缺失值的列
df.dropna(axis=1,how='all'|'any',subset=[''])

# 丢弃重复值
df.drop_duplicates()
排序
# 根据索引排序
df.sort_index()

# 根据某列排序
df.sort_values(by='Country')

# 将所有数据转化为序数数据
df.rank()
获取数据的信息
基础信息
# 前五个样本
df.head()

# (行,列)
df.shape

# index的范围和步长
df.index

# 每列的信息
df.columns

# 每列的数据类型
df.dtypes

# DataFrame的整体信息
df.info()

# 统计每列非零元素的个数
df.count()
总结信息
# 将数据按某些列分组
df.groupby([''])
在所有列上分别进行
# 求和
df.sum()
···
# 累加
df.cumsum()

# 极值
df.min()/df.max()
在数值列进行
# 显示统计量
df.describe()

# 显示均值
df.mean()

# 显示中位数
df.median()
基础数据探索
# 统计缺失值个数
df['col'].isnull().sum()

# 统计缺失值比例
df['col'].isnull().mean()

# 统计值的分布
df['col'].value_counts()
常用统计图
# 直方图(;不可省略)
df.hist();

# 条形图
s.plot(kind='bar')

# 相关性矩阵
sns.heatmap(df.corr(),annot=True,fmt='.2f')
Matplotlib
# 显示所有列
pd.set_option('display.max_columns', None)
# 修改标题
plt.title(title)
# 刷新缓冲区
Plt.show()
# 设置轴的范围
plt.axis([0, 6, 0, 20])
# plot
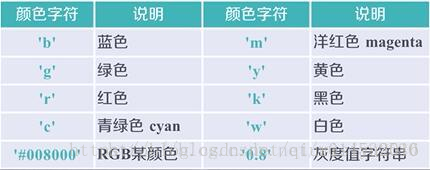
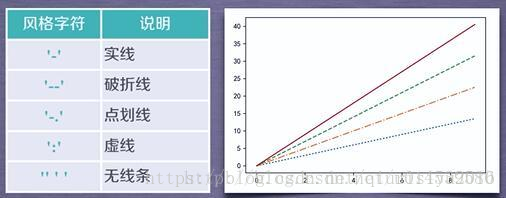
plt.plot(x,y,format_string,**kwargs)
x轴数据,y轴数据,format_string控制曲线的格式字串
修改数据的信息
# 重新生成索引(常用在数据筛选之后)
df.reset_index()

# 修改列名
df.rename(columns={'index': 'method',},inplace=)
使用函数
f = lambda x:x*2

# 作用在dataframe的一行或一列上
df.apply(f)

# 作用在dataframe的每个元素上
df.applymap(f)
数据对齐
缺失列默认用NaN补齐
可以用fill_value参数指定补齐数据
数据拼接
When gluing together multiple DataFrames, you have a choice of how to handle the other axes (other than the one being concatenated). This can be done in the following two ways:
-
Take the union of them all,
join='outer'. This is the default option as it results in zero information loss.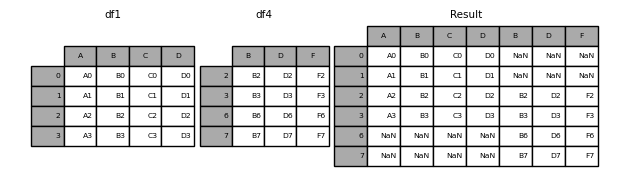
-
Take the intersection,
join='inner'.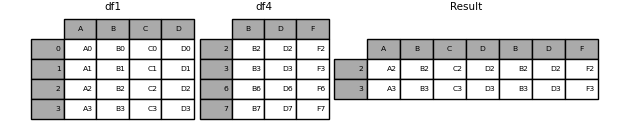
# concat 按列拼接(复用了df1的索引)
result = pd.concat([df1, df4], axis=1, join='inner'|'outer').reindex(df1.index)

# append 是concat函数axis=0的缩写
result = df1.append(df2)

# merge
df1.merge(df2,on=('key'))
汇总多列
reshapes the datasets to a long format
df.melt()

 浙公网安备 33010602011771号