

As a big enchancement, AX2012 has developed reports through Visual Studio with SSRS directly. That is meaning you can develop AX reports without x++. If you are a .net developer, you can do AX reports easily.
Pre-requirments:
SSRS + Visual Studio2010 + IIS7 + .Net4.0 framework
1, Create a Dynamics AX project (Report model or EP Web Application), here i select Report model and project named SSRSDemo.

2, In VS solution explorer, you can find your current solution. And right click project name, click Add [Your project name:SSRSDemo] to AOT.
3, Show Application explorer, you can view all AOT objects. And you can find your project in the AOT->Visual Studio Projects->Dynamics AX Model Projects->SSRSDemo.
4, If you add a report on your project such as salesstat and it will be showed on AOT->SSRS Reports->Reports->salesstat.
5, When you login AX client, you also can find them in AOT.
6, In SalesStat design overview, expend it and you can find DataSets, Designs, Images, Data Methods and Parameters nodes.
7, In Datasets node, Add a new dataset named SalesLine:
Its properties, Data source=Dynamics AX (Your AX database), Data source type=Query, Name=SalesLine and Query=select * from salesline (The query should exist in AOT-Query)
For data source type, it has four types:
a. Query - use a query from the AOT
b. Business Logic - use a data method from the report project
c. Report Data Provider - use the results of an X++ class
d. AX Enum Provider - use an enum from the AOT
Once you add the dataset successfully, you can expend fields and parameters if have on the SalesLine dataset node.
8, Drag salesline dataset to Designs node and it will generate a Design named SalesLineTable under AutoDesign1 automatically. You also add it by hand or create a precision design.
9, Designs->AutoDesign1->SalesLineTable node, it included groupings, sorting, fiters and data node (Here just discuss data and filters). Data is to show fields which you want to display on the report. Filters is the condition to filter records which you want.
Data i selected SalesId, ItemId, Name, CurrecyCode, LineAmount, Custgroup and CustAccount.
Filter i created a filter named CustFilter1.
10, Before we do filter, we setup parameters first. Create a parameter named PCustGroup and setup properties as below:
Multi Vaule= True, Default value=SalesLine-CustGroup (From dataset), Name= PCustGroup and Values= Databound Vaule-SalesLine(from dataset)
11, Setup a filter which named CustFilter and its properites is below:
Expression= =Fields!CustGroup.value, Name=CustFilter1, Operator=In (Because we enabled multi-values on PCustGroup) and Value=Parameters!PCustGroup.Value (We defined on Step 10)
12, A simple report is done and we can view it by Visual Studio.
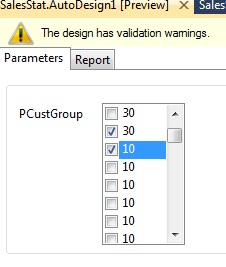
A, In AutoDesign1 node, right click and click preview. It will show two tab, one is for parameters which you defined filter, another is report to display records as your condition.
In parameters tab, click your filter condition such as Cust group is 30 and 10.
Then click report tab and wait the report gerenate.
13, The report was developed sucessfully, then build the SSRSDemo project and the action will save the project on model store. (Deploy also can update in AX)
14, Go to AX client, create a output menuitem, its properities is as below:
Name=SalesStat, ObjectType=SSRSReport, Object=SalesStat, ReportDesign=AutoDesign1
15, Right click SalesStat menuitem and click open to select as below and OK to run the report:

16, The report is show below:

