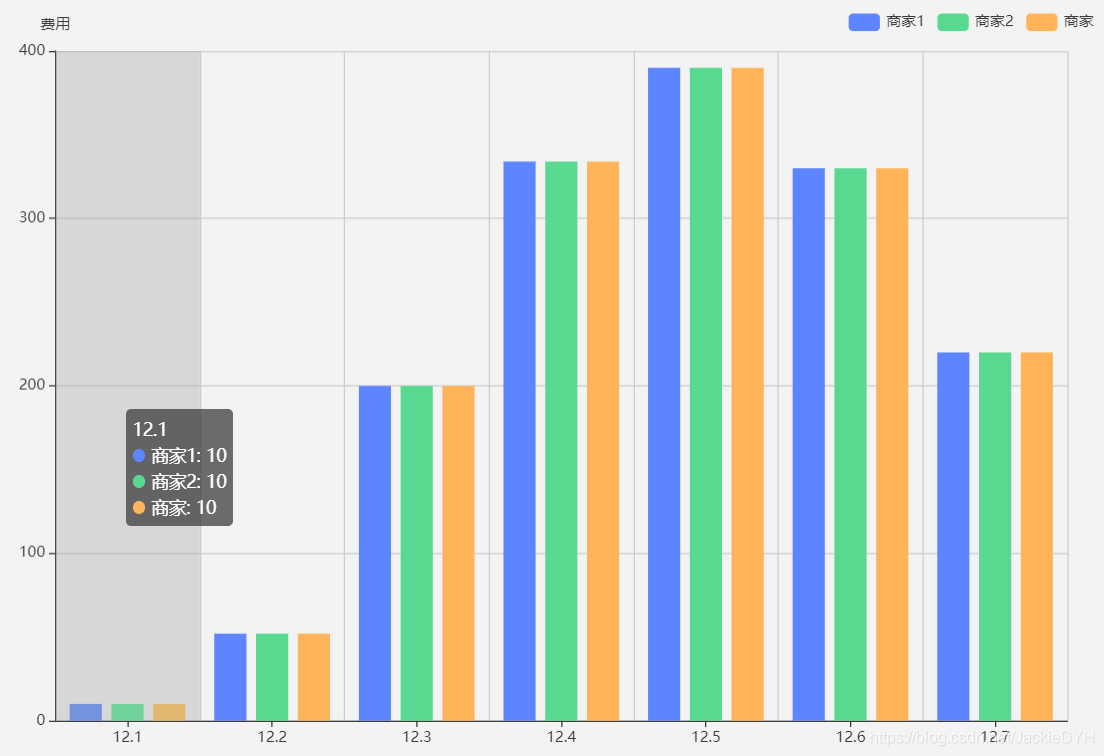
echarts堆叠柱状图参数配置案例

源码
option = {
    color: ['#5D85FF','#59D88F','#FFB459'],
    tooltip: {
        trigger: 'axis',
        axisPointer: {            // 坐标轴指示器,坐标轴触发有效
            type: 'shadow'        // 默认为直线,可选为:'line' | 'shadow'
        }
    },
    legend: {
          data: ["商家1", "商家2","商家"],
          orient: "horizontal",
          width: "200",
          x: "right", //图例位置
        //   y: "center",
          padding: [30, 15, 0, 0],
          textStyle: {
            //图例文字的样式
            color: "#333",
            fontSize: 12,
          },
    },
    grid: {
        left: '3%',
        right: '4%',
        bottom: '3%',
        containLabel: true
    },
    xAxis: [
        {
            type: 'category',
            splitLine: { show: true }, //去除网格线
            data: ['12.1', '12.2', '12.3', '12.4', '12.5', '12.6', '12.7'],
            axisTick: {
                alignWithLabel: true
            }
        }
    ],
    yAxis: [
        {
            type: "value",
            name: "费用",
            show: true,
            splitLine: { show: true }, //去除网格线
        }
    ],
    series: [
        {
            name: '商家1',
            type: 'bar',
            // barWidth: '30%',
            data: [10, 52, 200, 334, 390, 330, 220]
        },
        {
            name: '商家2',
            type: 'bar',
            // barWidth: '30%',
            data: [10, 52, 200, 334, 390, 330, 220]
        },
        {
            name: '商家',
            type: 'bar',
            // barWidth: '30%',
            data: [10, 52, 200, 334, 390, 330, 220]
        }
    ]
};

本文来自博客园,作者:JackieDYH,转载请注明原文链接:https://www.cnblogs.com/JackieDYH/p/17634412.html


【推荐】国内首个AI IDE,深度理解中文开发场景,立即下载体验Trae
【推荐】编程新体验,更懂你的AI,立即体验豆包MarsCode编程助手
【推荐】抖音旗下AI助手豆包,你的智能百科全书,全免费不限次数
【推荐】轻量又高性能的 SSH 工具 IShell:AI 加持,快人一步
· AI与.NET技术实操系列:基于图像分类模型对图像进行分类
· go语言实现终端里的倒计时
· 如何编写易于单元测试的代码
· 10年+ .NET Coder 心语,封装的思维:从隐藏、稳定开始理解其本质意义
· .NET Core 中如何实现缓存的预热?
· 分享一个免费、快速、无限量使用的满血 DeepSeek R1 模型,支持深度思考和联网搜索!
· 25岁的心里话
· 基于 Docker 搭建 FRP 内网穿透开源项目(很简单哒)
· ollama系列01:轻松3步本地部署deepseek,普通电脑可用
· 按钮权限的设计及实现