Echarts中legend图例的rich属性实现自定义样式

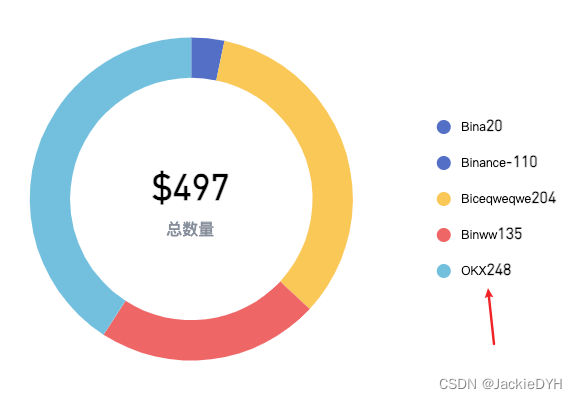
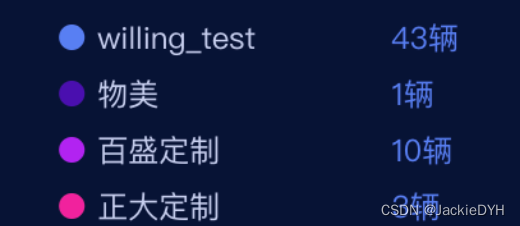
上图表,展示的字体颜色是不同的,而且和名称之间是有间距
使用rich实现
const options = {
    textStyle: {
        rich: {
           orgname: {
             fontSize: 12,
             width: 100,
           },
         count: {
              fontSize: 12
              verticalAlign: 'top',
              align: 'center',
              color: '#597FF3',
              padding: [0, 0, 0, 15],
             },
        },
    },
    legend: {
        formatter:(name) => {
            let target;
            const data = this.fmsDevice;
            for (let i = 0; i < data.length; i++) {
               if (data[i].orgname === name) {
                   target = `${data[i].count}辆`;
               }
           }
           const arr = [
               `{orgname|${name}}`,
               `{count|${target}}`,
            ];
           return arr.join('');
        }
    }
 }
在formatter自定义样式名称,在textStyle中定义样式内容。当然我们在自定义title样式时也可以使用同样的方法
使用rich设置axisLabel

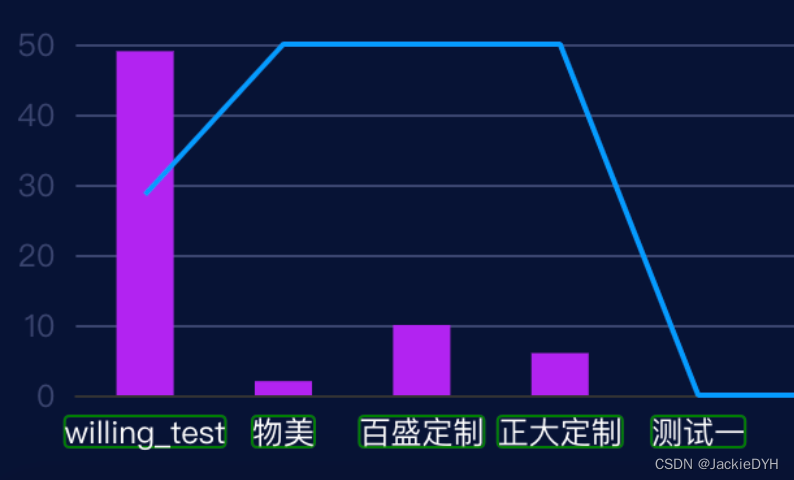
设置axisLabel的样式。可以在axisLabel中设置formtter,添加自定义样式名称
xAxis: [
    {
       axisLabel: {
          color: '#747DA0',
          fontSize: 12,
          formatter: name => (`{name|${name}}`),
          rich: {
             name: {
                color: '#fff',
                shadowBlur: 3,
                borderWidth: 1,
                borderColor: 'green',
                borderRadius: 2,
             },
          },
       },
    }
]
本文来自博客园,作者:JackieDYH,转载请注明原文链接:https://www.cnblogs.com/JackieDYH/p/17634016.html


【推荐】国内首个AI IDE,深度理解中文开发场景,立即下载体验Trae
【推荐】编程新体验,更懂你的AI,立即体验豆包MarsCode编程助手
【推荐】抖音旗下AI助手豆包,你的智能百科全书,全免费不限次数
【推荐】轻量又高性能的 SSH 工具 IShell:AI 加持,快人一步
· 分享一个免费、快速、无限量使用的满血 DeepSeek R1 模型,支持深度思考和联网搜索!
· 25岁的心里话
· 基于 Docker 搭建 FRP 内网穿透开源项目(很简单哒)
· ollama系列01:轻松3步本地部署deepseek,普通电脑可用
· 按钮权限的设计及实现