基于机器学习的异常流量监测代码实现
import numpy as np
import pandas as pd
from sklearn.neighbors import KNeighborsClassifier
import pydotplus
import matplotlib.pyplot as plt
import graphviz
# from sklearn.externals import joblib
from sklearn.metrics import roc_curve, auc, precision_score, recall_score, f1_score, accuracy_score
(1)KNN
clf = KNeighborsClassifier(algorithm='kd_tree', n_neighbors=8)
clf.fit(a, b)
(2)RF
clf = RandomForestClassifier(n_estimators=9, max_depth=7, min_samples_split=3, random_state=0)
clf.fit(a, b)
(3)DT
clf = tree.DecisionTreeClassifier(criterion='gini', max_depth=7, min_samples_leaf=4, min_samples_split=4)
clf.fit(a, b)
(4)SVM
clf = svm.SVC(kernel='rbf', decision_function_shape='ovr', probability=True)
clf.fit(a, b)
检测结果分析TP、FP、ACC、Precision、Recall、F1值等
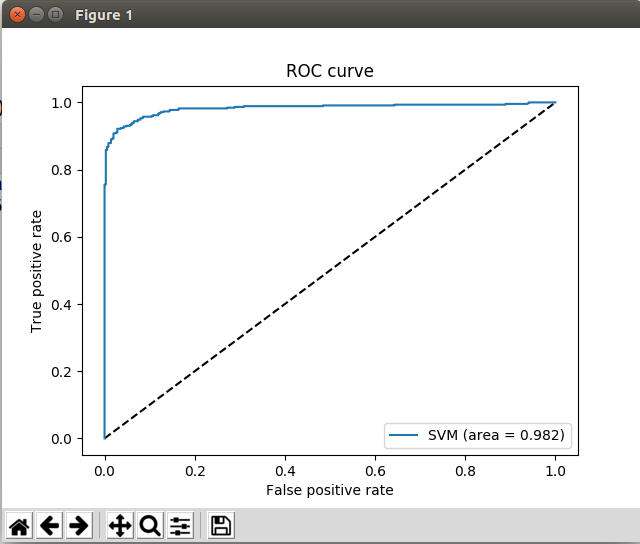
if __name__ == "__main__":
  dataSet = pd.read_excel("link_states_train_medium.xlsx")
  labelsp = list(dataSet.columns.values)

  labels = labelsp[0:4]

  clf = fit_model(dataSet, labels)
  data = pd.read_excel("link_states_test_medium.xlsx")

  y_true = data.iloc[:, -1]
  y_pred = clf.predict(data.iloc[:, :-1])
  prob = clf.predict_proba(data.iloc[:, :-1])[:, 1]
  print(prob.tolist())

  tp = sum(y_true & y_pred)
  fp = sum((y_true == 0) & (y_pred == 1))
  tn = sum((y_true == 0) & (y_pred == 0))
  fn = sum((y_true == 1) & (y_pred == 0))
  tpr = tp / (tp + fn)
  fpr = fp / (fp + tn)
  tnr = tn / (fp + tn)
  fnr = fn / (tp + fn)
  accuracy = accuracy_score(y_true, y_pred)
  precision = precision_score(y_true, y_pred)
  recall = recall_score(y_true, y_pred)
  f1_score = f1_score(y_true, y_pred)


  print("TP: " + str(tp))
  print("FP: " + str(fp))
  print("TN: " + str(tn))
  print("FN: " + str(fn))
  print("TPR: " + str(tpr))
  print("FPR: " + str(fpr))
  print("TNR: " + str(tnr))
  print("FNR: " + str(fnr))
  print("Accuracy: " + str(accuracy))
  print("Precision: " + str(precision))
  print("Recall: " + str(recall))
  print("F1 Score: " + str(f1_score))

  print(y_true.tolist())
  # print(y_pred.tolist())

  fpr, tpr, thresholds_keras = roc_curve(y_true, prob)
  auc = auc(fpr, tpr)
  print("AUC : ", auc)
  plt.figure()
  plt.plot([0, 1], [0, 1], 'k--')
  plt.plot(fpr, tpr, label='SVM (area = {:.3f})'.format(auc))
  plt.xlabel('False positive rate')
  plt.ylabel('True positive rate')
  plt.title('ROC curve')
  plt.legend(loc='best')
  # plt.savefig("../images/ROC/ROC_2分类.png")
  plt.show()
本文来自博客园,作者:Jcpeng_std,转载请注明原文链接:https://www.cnblogs.com/JCpeng/p/14990073.html

 浙公网安备 33010602011771号