echarts的相关配置--气泡图

代码示例:

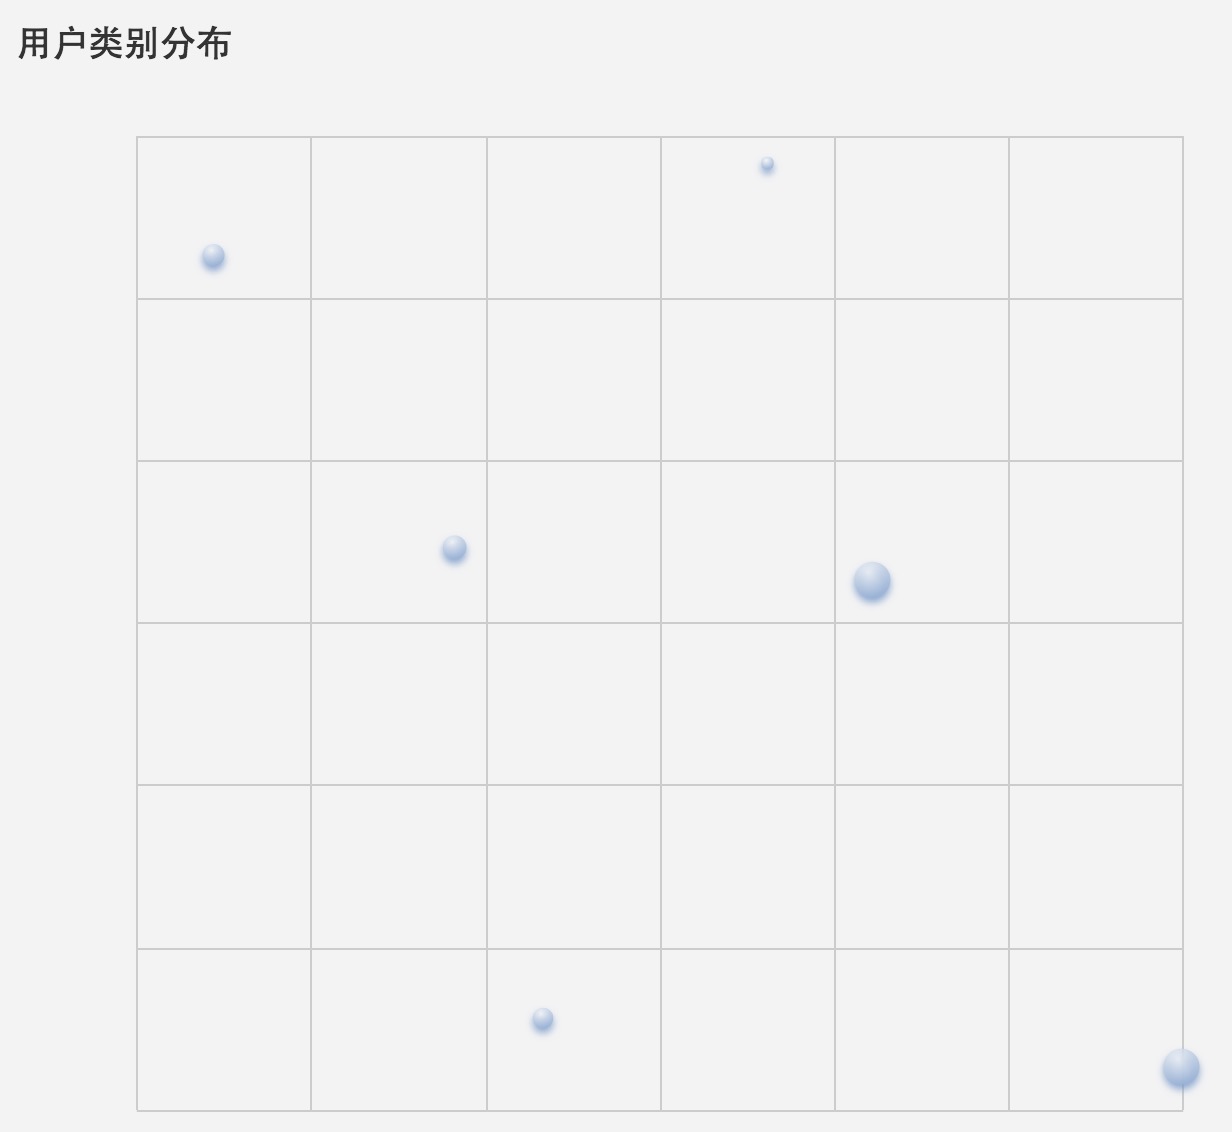
var data = [
                    [[440009956, 81.8, 29968000, 'Australia', 2015],[2329400000, 67.7, 25939920, 'Canada', 2015], [4218200000, 75.8, 80294200, 'Iceland', 2015], [5990000000, 66.8, 81050200, 'India', 2015], [3616200000, 83.5, 9673180, 'Japan', 2015],  [1822500000, 76.4, 34715000, 'United Kingdom', 2015]]
                ];     //气泡图的数据值

                var option = {
                    title: {
                        text: '用户类别分布'      //图表名称
                    },
                    tooltip: {     //鼠标hover出现的tooltip框
                        show: true
                    },
                    legend: {        
                        right: 10,
                        data: ['2015']
                    },
                    xAxis: {
                        axisLine: {       //x坐标轴的轴线
                            show: false
                        },
                        axisTick: {       //x轴的刻度线
                            show: false
                        },
                        axisLabel: {      //x轴的刻度值
                            show: false
                        },
                        splitLine: {      //x轴的网格线
                            lineStyle: {
                                type: 'solid'    //设置实心的网格线
                            }
                        }
                    },
                    yAxis: {
                        axisLine: {     //y坐标轴的轴线
                            show: false
                        },
                        axisTick: {    //y轴的刻度
                            show: false
                        },
                        axisLabel: {   //y轴的刻度值
                            show: false
                        },
                        splitLine: {    //y轴的网格线
                            lineStyle: {
                                type: 'solid'   //设置实心的网格线
                            }
                        },
                        scale: true
                    },
                    series: [{
                        data: data[0],
                        type: 'scatter',
                        hoverAnimation: false,   //避免鼠标悬浮在区块时区块放大
                        symbolSize: function (data) {
                            return Math.sqrt(data[2]) / 5e2;
                        },
                        label: {
                            emphasis: {      //鼠标hover上去的文字提示
                                show: true,
                                formatter: function (param) {
                                    return param.data[3];
                                },
                                position: 'top'    //鼠标hover上去的文字提示所处的位置
                            }
                        },
                        itemStyle: {
                            normal: {
                                shadowBlur: 10,    //气泡图blur的值
                                shadowColor: '#7496c7',   
                                shadowOffsetY: 5,
                                color: new echarts.graphic.RadialGradient(0.4, 0.3, 1, [{    //气泡图的颜色,此处为渐变色
                                    offset: 0,
                                    color: 'rgb(250, 250, 250)'
                                }, {
                                    offset: 1,
                                    color: '#7496c7'
                                }])
                            }
                        }
                    }]
                };


效果图如下:

关于饼图和柱状图的知识,请见:

饼图:echarts的相关配置—饼图

柱状图:echarts的相关配置—柱状图


posted @ 2017-08-30 14:58  小小夏123  Views(1574)  Comments(0Edit  收藏  举报