lshort笔记:绘图功能(七)
本文内容来自一份 (不太) 简短的 LATEX2ε 介绍。
除了排版文字,\(\LaTeX{}\) 也支持用代码表示图形。不同的扩展已极大丰富了 \(\LaTeX{}\) 的图形功能,TikZ 就是其中之一。本章将带你了解一些基本的绘图功能。
绘图语言简介
\(\LaTeX{}\) 提供了原始的 \(\texttt{picture}\) 环境,能够绘制一些基本的图形如点、线、矩形、圆、B'ezier 曲线等等,不过受制于 \(\LaTeX{}\) 本身,它的绘图功能极为有限,效果也不够美观。
当前较为流行的、用于 \(\LaTeX{}\) 的绘图宏包/程序主要有:
-
\(\textrm{PSTricks}\)
以 \(\textrm{PostSciprt}\) 语法为基础的绘图宏包,具有优秀的绘图能力。它对老式的 \(\texttt{latex + dvips}\) 编译命令支持最好,而现在的几种编译命令下使用起来都不够方便。
-
\(\textrm{TikZ}\) \(\&\) \(\textrm{pgf}\)
德国的 Till Tantau 教授在开发著名的 \(\LaTeX{}\) 幻灯片文档类 \(\texttt{beamer}\) 时一并开发了绘图宏包
pgf,目的是令其能够在 \(\texttt{pdflatex}\) 或 \(\texttt{xelatex}\) 等不同的编译命令下都能使用。\(\textrm{TikZ}\) 是在pgf基础上封装的一个宏包,采用了类似 \(\texttt{METAPOST}\) 的语法,提供了方便的绘图命令,绘图能力不输 \(\textrm{PSTricks}\) 。 -
\(\textrm{METAPOST}\) \(\&\) \(\textrm{Asymptote}\)
\(\textrm{METAPOST}\) 脱胎于高德纳为 \(\TeX{}\) 配套开发的字体生成程序 \(\textrm{METAFONT}\),具有优秀的绘图能力,并能够调用 \(\TeX{}\) 引擎向图片中插入文字和公式。\(\textrm{Asymptote}\) 在 \(\textrm{METAPOST}\) 的基础上更进一步,具有一定的类似 C 语言的编程能力,支持三维图形的绘制。
它们作为独立的程序,通常的用法是将代码写在单独的文件里,编译生成图片供 \(\LaTeX{}\) 引用,也可以借助特殊的宏包在 \(\LaTeX{}\) 代码里直接使用。
\(\textrm{TikZ}\) 绘图语言
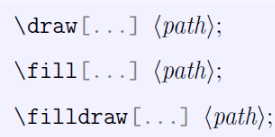
在导言区调用 \(\textrm{TikZ}\) 宏包,就可以用以下命令和环境使用 \(\textrm{TikZ}\) 的绘图功能了(\(\texttt{latex + dvipdfmx}\) 编译方式要在 \(\textrm{TikZ}\) 宏包之前调用 graphicx 宏包并指定 \(\texttt{dvipdfmx}\) 选项。):
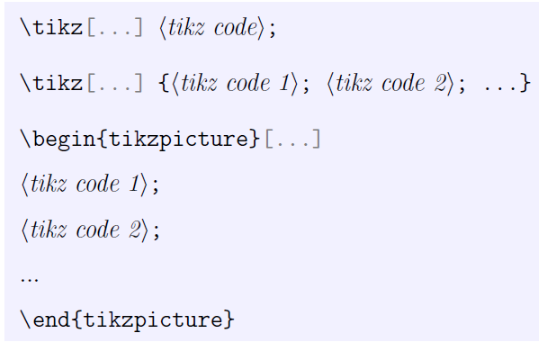
前一种用法为 \tikz 带单条绘图命令,以分号结束,一般用于在文字之间插入简单的图形;
后两种用法较为常见,使用多条绘图命令,可以在 \(\texttt{figure}\) 等浮动体中使用。
\(\textrm{TikZ}\) 坐标和路径
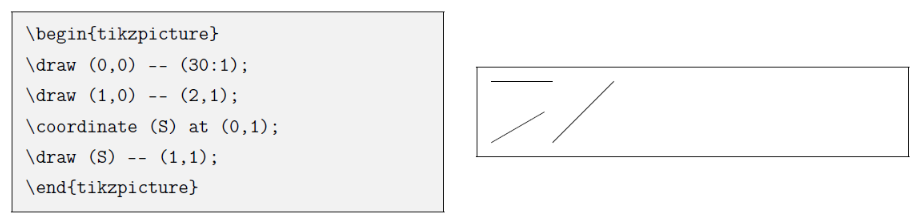
\(\textrm{TikZ}\) 用直角坐标系或者极坐标系描述点的位置。
- 直角坐标下,点的位置写作
(<x>,<y>),坐标<x>和<y>可以用 \(\LaTeX{}\) 支持的任意单位表示, 缺省为 \(\texttt{cm}\); - 极坐标下,点的位置写作 \((\theta:r)\)。\(\theta\) 为极角,单位是度。
还可以为某个点命名:\coordinate (A) at (<coordinate>),然后就可以使用 \(\texttt{(A)}\) 作为点的位置了。
\begin{tikzpicture}
\draw (0,0) -- (30:1);
\draw (1,0) -- (2,1);
\coordinate (S) at (0,1);
\draw (S) -- (1,1);
\end{tikzpicture}
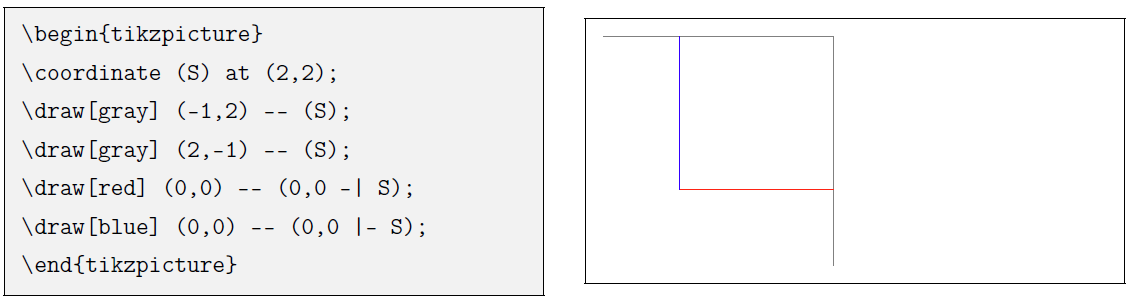
坐标的表示形式还包括“垂足”形式:
\begin{tikzpicture}
\coordinate (S) at (2,2);
\draw[gray] (-1,2) -- (S);
\draw[gray] (2,-1) -- (S);
\draw[red] (0,0) -- (0,0 -| S);
\draw[blue] (0,0) -- (0,0 |- S);
\end{tikzpicture}
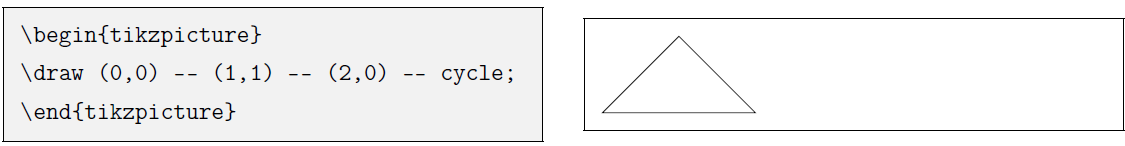
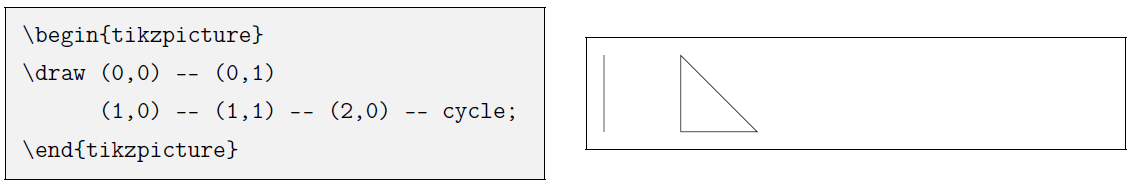
\(\textrm{TikZ}\) 最基本的路径为两点之间连线,如 \((x_1,y_1) -- (x_2,y_2)\),可以连用表示多个连线(折线)。连续使用连线时,可以使用 \(\texttt{cycle}\) 令路径回到起点,生成闭合的路径。
\begin{tikzpicture}
\draw (0,0) -- (1,1) -- (2,0) -- cycle;
\end{tikzpicture}
多条路径可用于同一条画图命令中,以空格分隔:
\begin{tikzpicture}
\draw (0,0) -- (0,1)
      (1,0) -- (1,1) -- (2,0) -- cycle;
\end{tikzpicture}
其它常用的路径还包括:
-
矩形、圆和椭圆:
\begin{tikzpicture}
\draw (0,0) rectangle (1.5,1);
\draw (2.5,0.5) circle [radius=0.5];
\draw (4.5,0.5) ellipse
    [x radius=1,y radius=0.5];
\end{tikzpicture}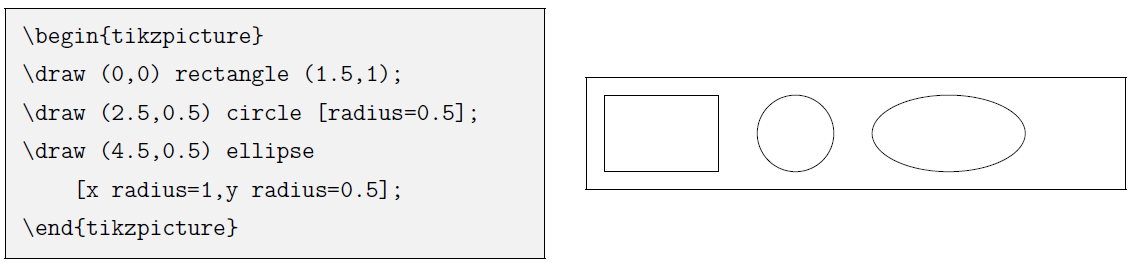
-
直角、圆弧、椭圆弧
\begin{tikzpicture}
\draw (0,0) |- (1,1);
\draw (1,0) -| (2,1);
\draw (4,0) arc (0:135:1);
\draw (6,0) arc (0:135:1 and 0.5);
\end{tikzpicture}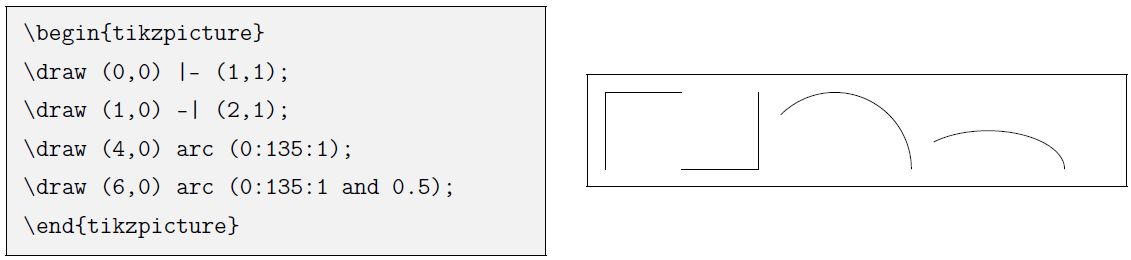
-
正弦、余弦曲线(1/4 周期):
\begin{tikzpicture}
\draw (0,0) sin (1,1);
\draw (0,1) sin (1,0);
\draw (2,1) cos (3,0);
\draw (2,0) cos (3,1);
\end{tikzpicture}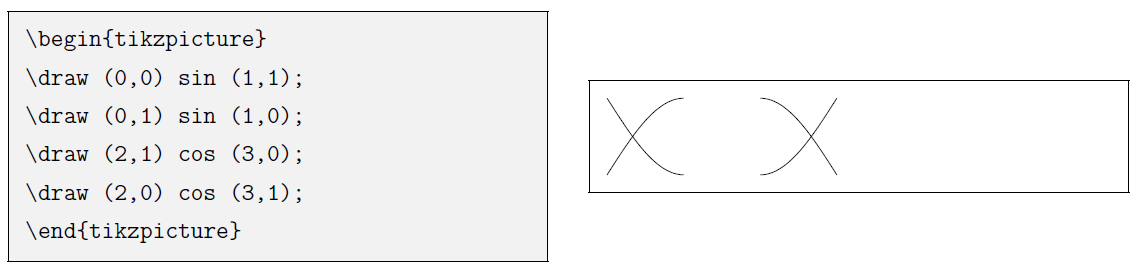
-
抛物线,用 \(\texttt{bend}\) 控制顶点:
\begin{tikzpicture}
\draw (0,0) parabola (1,2);
\draw (2,0) parabola
      bend (2.25,-0.25) (3,2);
\draw (4,0) parabola
      bend (4.75,2.25) (5,2);
\end{tikzpicture}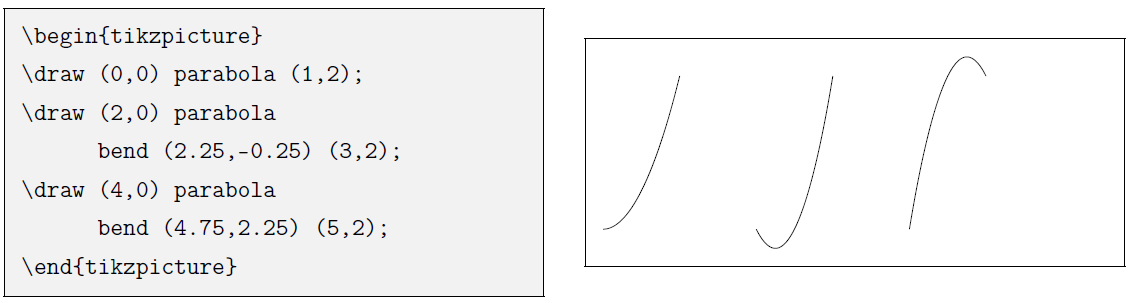
-
二次和三次 B'ezier 曲线,分别使用一个和两个控制点:
\begin{tikzpicture}
\draw (0,0) .. controls
  (2,1) and (3,1) .. (3,0);
\draw (4,0) .. controls
  (5,1) .. (5,0);
\draw[help lines] (0,0)
  -- (2,1) -- (3,1) -- (3,0)
  (4,0) -- (5,1) -- (5,0);
\end{tikzpicture}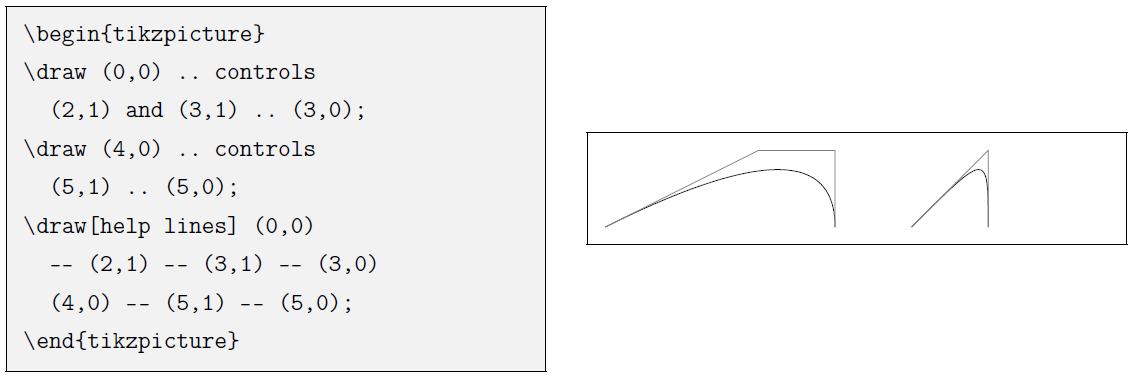
-
网格、函数图像,网格可用 \(\texttt{step}\) 参数控制网格大小,函数图像用 \(\texttt{domain}\) 参数控制定义域:
\begin{tikzpicture}
\draw[help lines,step=0.5]
     (-1,-1) grid (1,1);
\draw[->] (-1.5,0) -- (1.5,0);
\draw[->] (0,-1.5) -- (0,1.5);
\draw[domain=-1:1]
     plot(\x,{\x*\x*2 -1});
\end{tikzpicture}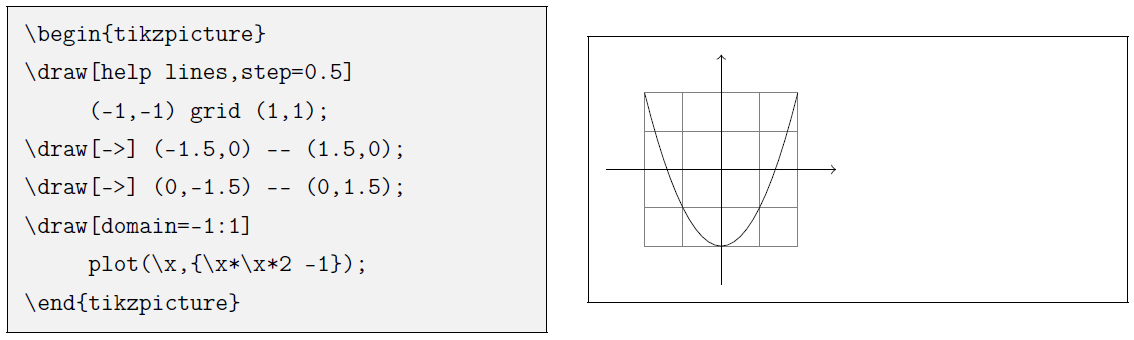
\(\textrm{TikZ}\) 绘图命令和参数
除了 \draw 命令之外,\(\textrm{TikZ}\) 还提供了 \fill 命令用来填充图形,\filldraw 命令则同时填充和描边。除了矩形、圆等现成的闭合图形外,\fill 和 \filldraw 命令也能够填充人为构造的闭合路径。
绘图参数可作为可选参数用在 \(\texttt{tikzpicture}\) 环境或 \tikz 命令时,参数会影响到所有具体的绘图命令;用在单个绘图命令 \draw、\filldraw 等时,只对这个命令起效。
\(\textrm{TikZ}\) 有数不清的绘图参数,这些参数令 \(\textrm{TikZ}\) 能够绘制丰富多彩的图像,同时也令其难以精通。以下示例常用的一些绘图参数。
-
\(\texttt{color/draw/fill=<color>}\) 为
\draw或\fill等命令指定颜色。\(\texttt{draw}\) 和 \(\texttt{fill}\) 分别指定描边和填充的颜色,而 \(\texttt{color}\) 同时指定,也可以省略 \(\texttt{color=}\) 直接写颜色名称。\begin{tikzpicture}[thick] \draw[blue] (0,0) rectangle (1,1); \filldraw[fill=yellow,draw=red] (2,0.5) circle [radius=0.5]; \end{tikzpicture}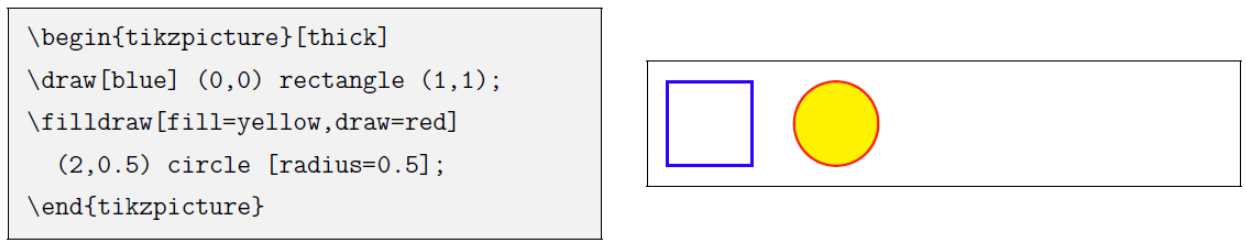
-
\(\texttt{thick=<length>/thin/semithick/...}\) 指定线条的粗细。
\begin{tikzpicture}
\draw[ultra thin] (0,0)--(0,2);
\draw[very thin] (0.5,0)--(0.5,2);
\draw[thin] (1,0)--(1,2);
\draw[semithick] (1.5,0)--(1.5,2);
\draw[thick] (2,0)--(2,2);
\draw[very thick] (2.5,0)--(2.5,2);
\draw[ultra thick] (3,0)--(3,2);
\end{tikzpicture}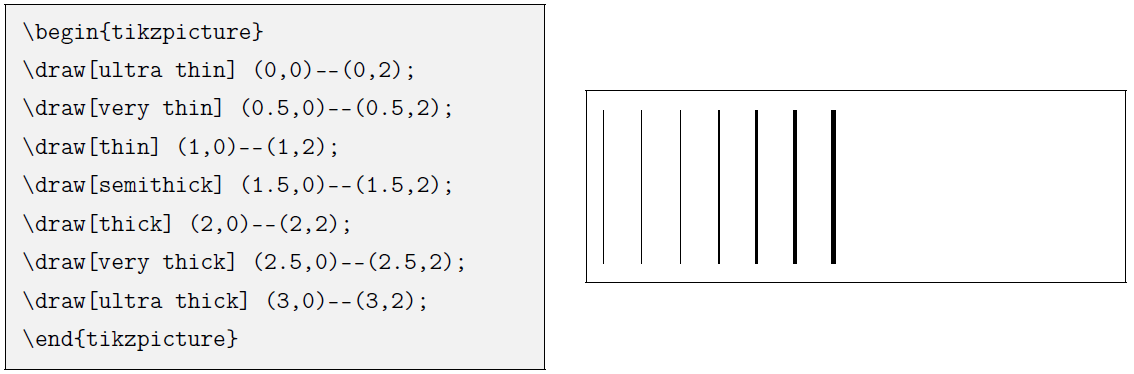
-
\(\texttt{solid/dashed/dotted/dash dot/dash dot dot}\) 指定线条类型(实线、虚线、点划线等)。与 \(\texttt{dashed}\) 对应地有 \(\texttt{densely dashed}\) 和 \(\texttt{loosely dashed}\),后三种类型同理。
\begin{tikzpicture}
\draw[dashed] (0,0) -- (0,2);
\draw[dotted] (0.5,0) -- (0.5,2);
\draw[dash dot] (1,0) -- (1,2);
\draw[dash dot dot] (1.5,0) -- (1.5,2);
\draw[densely dotted]
   (2,0) -- (3,2) -- (4,0) -- cycle;
\end{tikzpicture}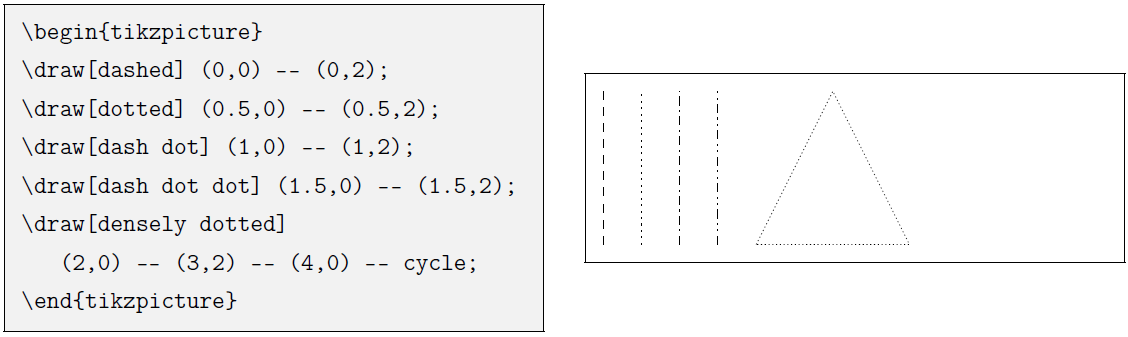
-
\(\texttt{arrow - arrow}\) 指定线条首尾的箭头形式。复杂的箭头形式需要在导言区使用
\usetikzlibrary{arrows.meta}。\begin{tikzpicture}[thick] \draw[->] (0,4) -- (3,4); \draw[->>] (0,3.5) -- (3,3.5); \draw[->|] (0,3) -- (3,3); \draw[<-] (0,2.5) -- (3,2.5); \draw[<->] (0,2) -- (3,2); \draw[>->|] (0,1.5) -- (3,1.5); \draw[-stealth] (0,1) -- (3,1); \draw[-latex] (0,0.5) -- (3,0.5); \draw[-to] (0,0) -- (3,0); \end{tikzpicture}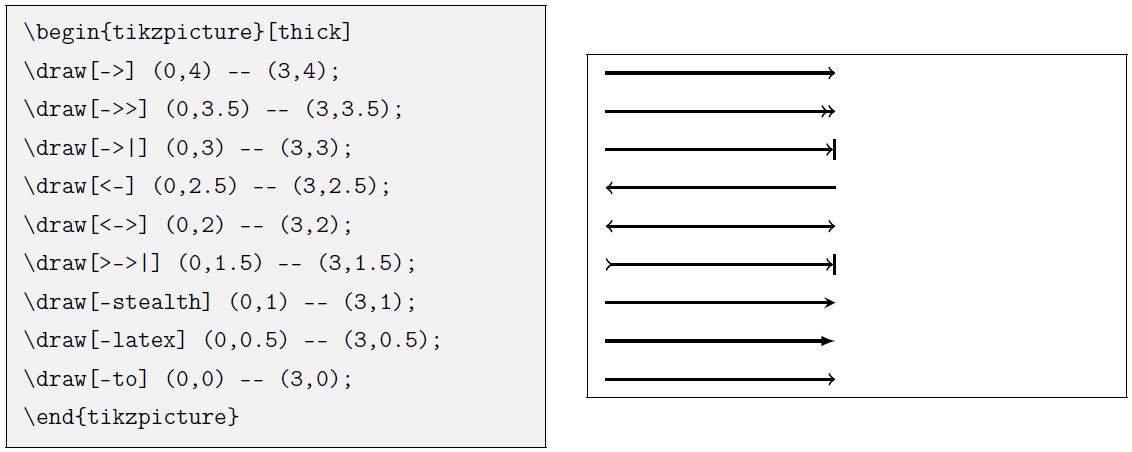
-
\(\texttt{rounded corners[=<radius>]/sharp corners}\) 将路径转向处绘制成圆角/直角。可选参数
<radius>控制圆角的半径。可对某一段路径直接使用。\begin{tikzpicture} \draw[rounded corners] (0,0) rectangle (1,1); \draw (2,0) -- (2,1) [rounded corners=.3cm] -- (3,1) -- (3.5,0) [sharp corners] -- cycle; \end{tikzpicture}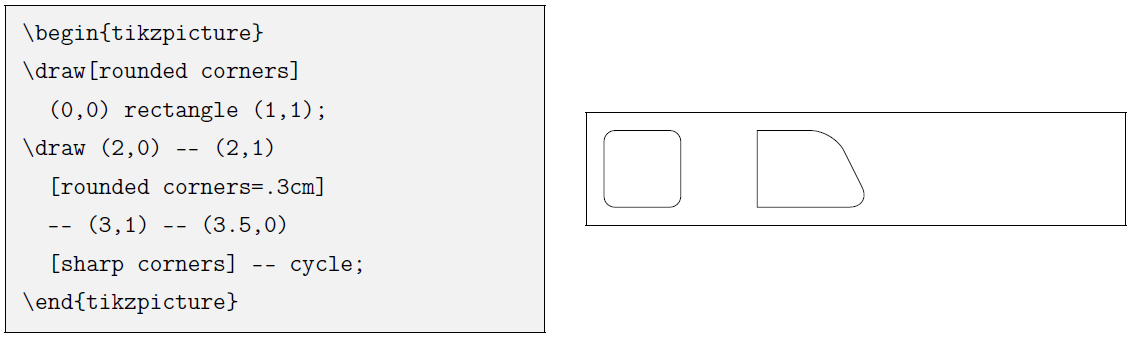
-
\(\texttt{scale/xshift/yshift/xslant/yslant/rotate}\) 设定图形的缩放、位移和旋转。
\begin{tikzpicture}
\draw[help lines](0,0) rectangle (1,1);
\draw[scale=1.5] (0,0) rectangle (1,1);
\draw[rotate=30] (0,0) rectangle (1,1);
\draw[help lines](2,0) rectangle (3,1);
\draw[yshift=4pt](2,0) rectangle (3,1);
\draw[help lines](4,0) rectangle (5,1);
\draw[xslant=0.4](4,0) rectangle (5,1);
\end{tikzpicture}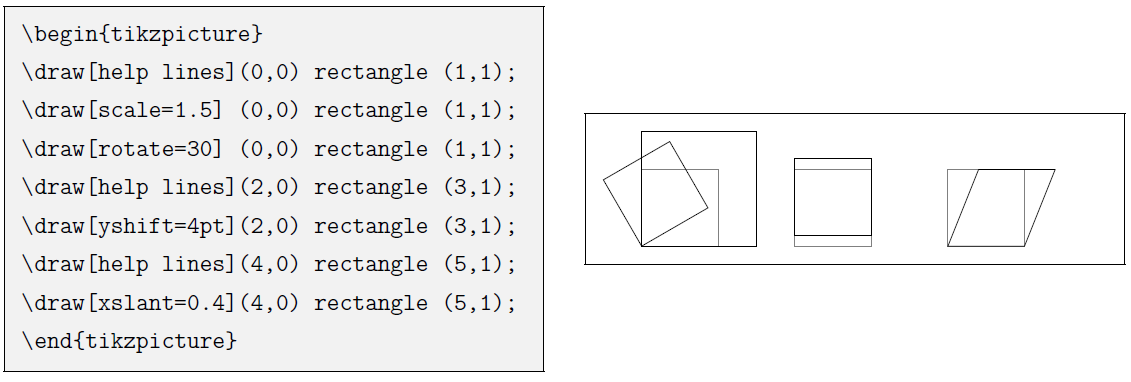
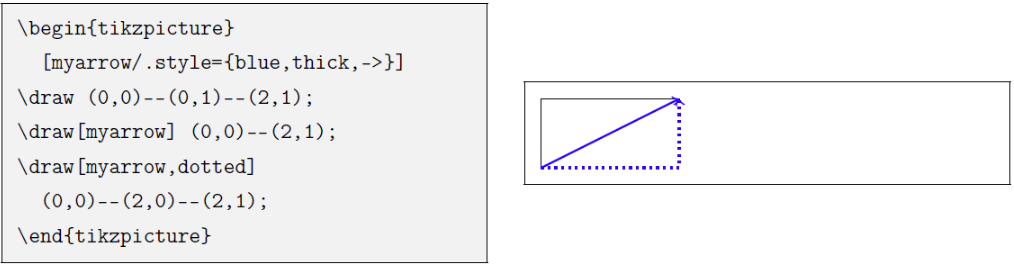
为了重复利用绘图参数,减少代码冗余,\(\textrm{TikZ}\) 引入了“样式”的概念,可以定义一个样式包含绘图参数,然后将样式作为一个参数用于绘图:
\begin{tikzpicture}
  [myarrow/.style={blue,thick,->}]
\draw (0,0)--(0,1)--(2,1);
\draw[myarrow] (0,0)--(2,1);
\draw[myarrow,dotted]
  (0,0)--(2,0)--(2,1);
\end{tikzpicture}
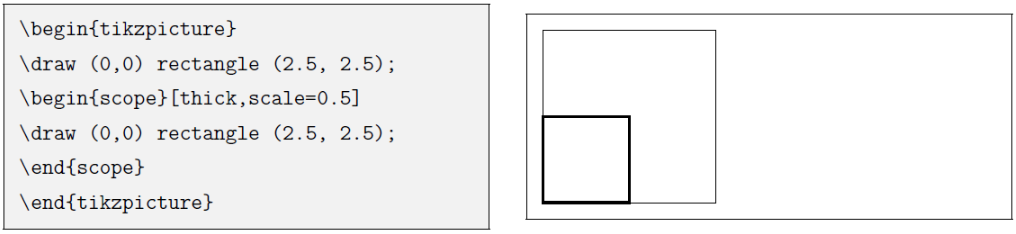
\(\textrm{TikZ}\) 还提供了\(\texttt{scope}\) 环境,令绘图参数或样式在局部生效:
\begin{tikzpicture}
\draw (0,0) rectangle (2.5, 2.5);
\begin{scope}[thick,scale=0.5]
\draw (0,0) rectangle (2.5, 2.5);
\end{scope}
\end{tikzpicture}
\(\textrm{TikZ}\) 文字结点
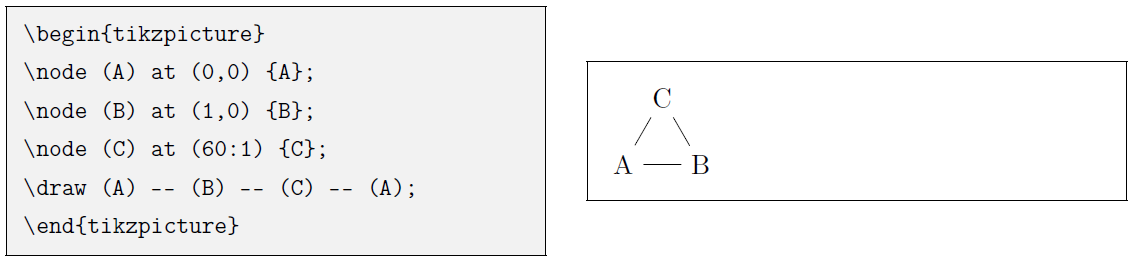
\(\textrm{TikZ}\) 用 \node 命令绘制文字结点:
\node[<options>] (<name>) at (<coordinate>) {<text>};
\(\texttt{(<name>)}\) 为结点命名,类似 \coordinate;\(\texttt{at (<coordinate>)}\) 指定结点的位置。这两者和前面的 <options> 都可以省略,只有 <text> 是必填的。
\begin{tikzpicture}
\node (A) at (0,0) {A};
\node (B) at (1,0) {B};
\node (C) at (60:1) {C};
\draw (A) -- (B) -- (C) -- (A);
\end{tikzpicture}
上一 小节中的参数可用于 \node 命令的配置。除此之外,\node 还有一些特定的参数:
-
\(\texttt{anchor=<position>}\) 令结点的某个角落
<position>与<coordinate>对应。 -
\(\texttt{centered}\)/\(\texttt{above}\)/\(\texttt{below}\)/\(\texttt{left}\)/\(\texttt{right}\)/\(\texttt{above left}\)/\(\ldots [=<length>]\) 与 \(\texttt{anchor}\) 等效的选项。可选的
<length>为结点相对于<coordinate>的距离。\begin{tikzpicture} \coordinate (A) at (1,1); \fill (A) circle[radius=2pt]; \node[draw,anchor=south] at (A) {a}; \node[draw,below right=4pt] at (A) {b}; \end{tikzpicture}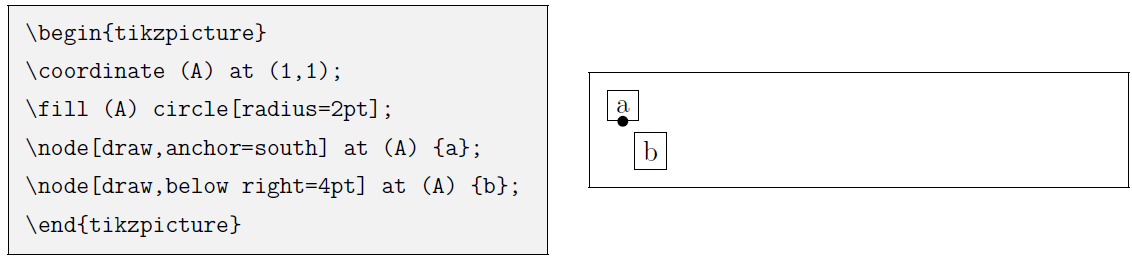
-
\(\texttt{shape=<shape>}\) 结点的形状,默认可用 \(\texttt{rectangle}\) 和 \(\texttt{circle}\),可省略 \(\texttt{shape=}\) 直接写。在导言区使用命令
\usetikzlibrary{shapes.geometric}可用更多的形状。 -
\(\texttt{text=<color>}\) 结点文字的颜色。
-
\(\texttt{node font={<font command>}}\)结点文字的字体,形如
\bfseries或\itshape等。\begin{tikzpicture} \node[circle,fill=blue,text=white, node font={\bfseries}] (A) at (0,0) {A node}; \node[rectangle,rounded corners, draw=gray, node font={\sffamily\slshape}] (B) at (2,0) {B node}; \end{tikzpicture}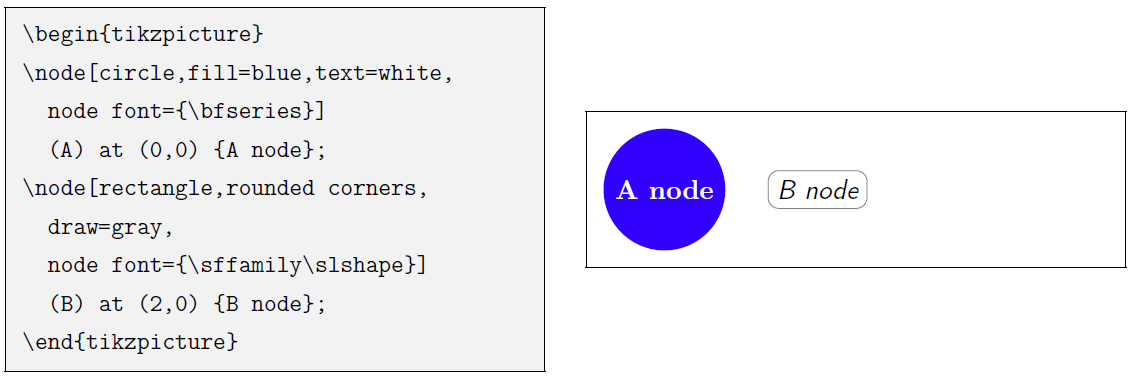
-
\(\texttt{inner sep= <length>} / \texttt{outer sep=<length>}\) 结点边界向外和向内的额外距离。
-
\(\texttt{minimum size=<length>}\) / \(\texttt{minimum height=<length>}\) /\(\texttt{minimum width=<length>}\)结点的最小大小或最小高度/宽度。
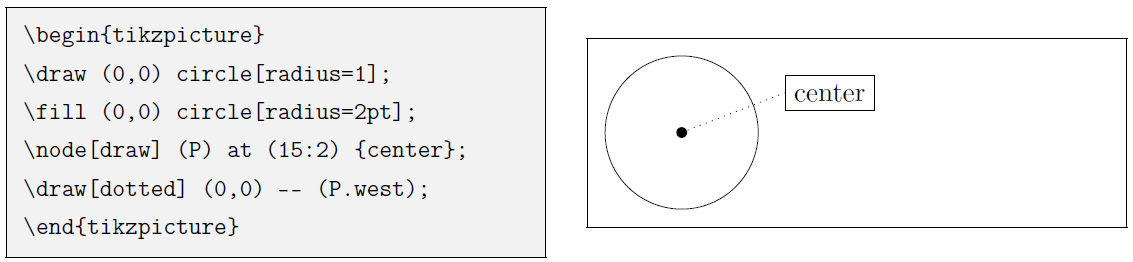
\node 命令不仅为文字结点的位置命名,在 \draw 等命令中还可以使用某个结点的相对位置,以“东南西北”的方式命名:
\begin{tikzpicture}
\draw (0,0) circle[radius=1];
\fill (0,0) circle[radius=2pt];
\node[draw] (P) at (15:2) {center};
\draw[dotted] (0,0) -- (P.west);
\end{tikzpicture}
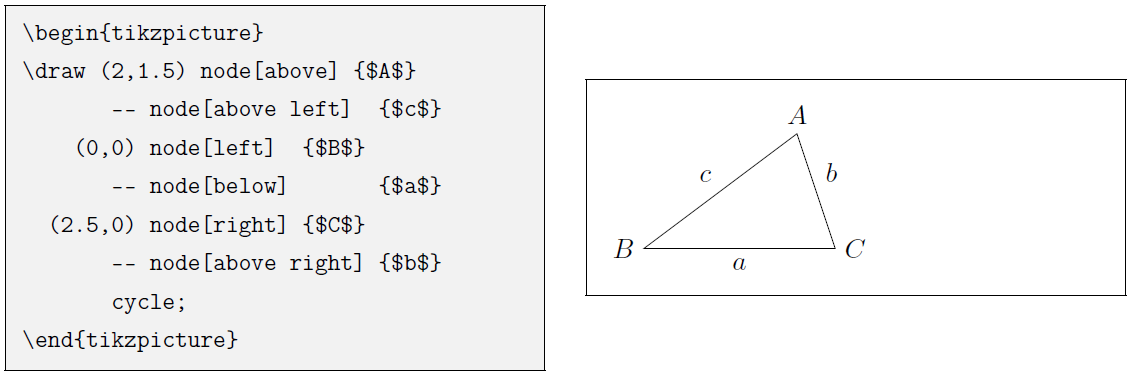
\node 命令的一种等效用法是在 \draw 等命令的路径中使用 \(\texttt{node}\),不仅可以对某个位置标记结点,还能够对线标记:
\begin{tikzpicture}
\draw (2,1.5) node[above] {$A$}
       -- node[above left]  {$c$}
    (0,0) node[left]  {$B$}
       -- node[below]       {$a$}
  (2.5,0) node[right] {$C$}
       -- node[above right] {$b$}
       cycle;
\end{tikzpicture}
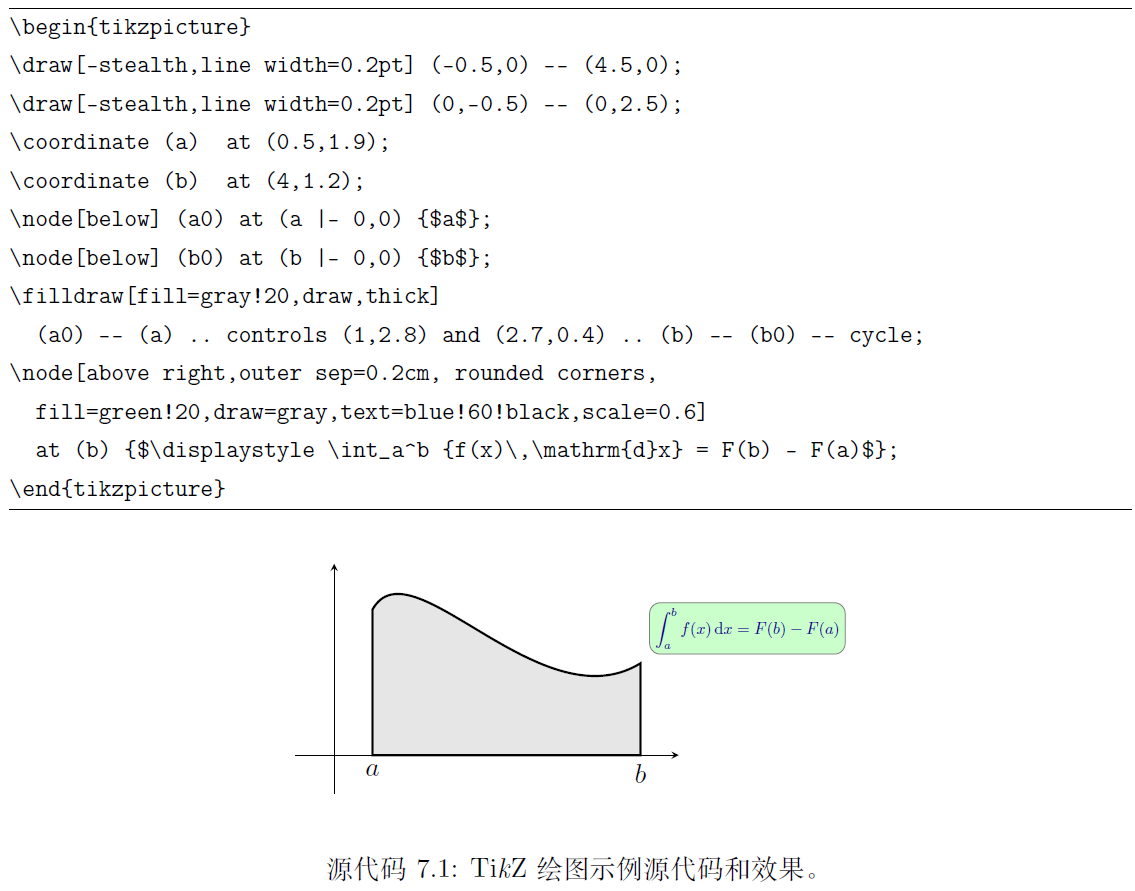
在此举一个较为复杂的例子,综合前面介绍过的各种路径、形状、文字结点和参数设置,见下面的源代码。
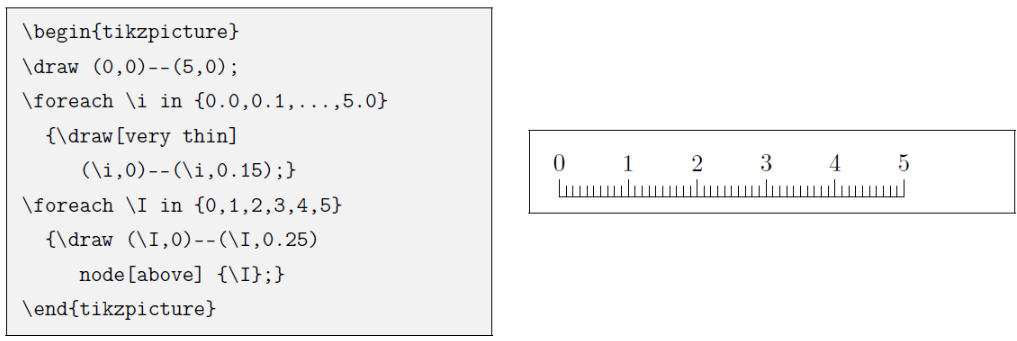
在 \(\textrm{TikZ}\) 中使用循环
\(\textrm{TikZ}\) 通过 pgffor 功能宏包实现了简单的循环功能,语法为:
\foreach \a in {<list>} {<commands>}
上述语法定义了 \a 为变量,在 <commands> 中使用 \a 完成循环。
<list> 可以直接将所有值写出来,如 \(\texttt{1,2,3,4}\);也可以写成省略形式,如 \(\texttt{1,2,...,10}\)。
\begin{tikzpicture}
\draw (0,0)--(5,0);
\foreach \i in {0.0,0.1,...,5.0}
  {\draw[very thin]
     (\i,0)--(\i,0.15);}
\foreach \I in {0,1,2,3,4,5}
  {\draw (\I,0)--(\I,0.25)
     node[above] {\I};}
\end{tikzpicture}
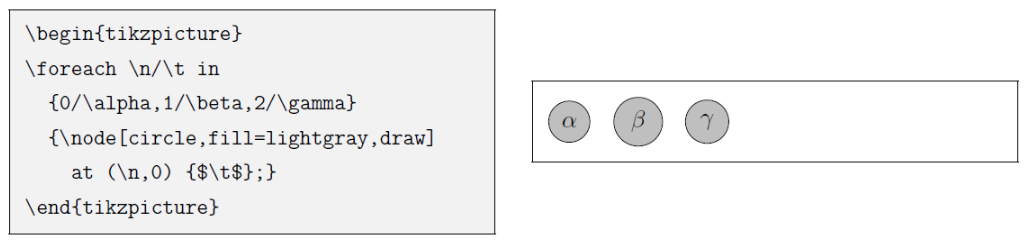
\foreach 还可使用变量对参与循环:
\begin{tikzpicture}
\foreach \n/\t in
  {0/\alpha,1/\beta,2/\gamma}
  {\node[circle,fill=lightgray,draw]
    at (\n,0) {$\t$};}
\end{tikzpicture}

 浙公网安备 33010602011771号