机器学习笔记02(Where does the error come from?)
Where does the error come from?
1、首先,error的两大来源bias和variance是指什么
2、然后,bias和variance是怎么产生的
3、进一步,如何判断你的model是bias大(欠拟合)还是variance大(过拟合),如何解决
4、model selection 更好的方法
5、总结、结论
1、首先,error的两大来源bias和variance是指什么
Average error on testing data:error due to "bias" and error due to "variance“
在测试中的误差来自于:偏差和方差
首先 Regression的目的是,对于一组 training data,我们需要找到一个合适的model,进行拟合,使得这个model在test data上表现良好。
其次 对于f(x),Estimate the mean of a variable x:assume the mean of x is 𝜇 ;assume the variance(方差) of x is σ2
再者 有一组实际的 train data,(x1, y1),(x2, y2),(x3, y3)......(xn, yn)
1)bias 偏差
令 m=1/n ∑ xn = ( x1 + x2 + x3 + ...... + xn ) / n 则有 m ≠ μ
而 E(m) = E(1/n ∑xn) = 1/n ∑ E(xn ) = μ
即 对于 x 的期望值为 μ ,但实际的 training data 中的 x 的平均值并不为 μ,而与 μ 存在一定的偏差 bias。
当样本数越来越多时,则 m 与 μ 会越来越接近,偏差也会越来越小。
2)variance 方差
同样的,理想的方差为 σ2 = 1/n ∑ (yn - μ)2
实际train data中,方差 s2 = 1/n ∑ (yn - m)2
且, E(s2) = (n-1)/n σ2 ≠ σ2
即方差与期望值不同,主要因为实际样本值yn 与均值 m 存在一定差距。
方差表示的是离散程度,方差越大,数据距离均值的距离就越远。
3)直观图形
图一  图二
图二 
目标均值(期望均值),即 μ 为中心红点
图一: Small variance Large Bias,数据较为集中,因此方差较小;但是数据均值 m 与 μ 距离较大,因此偏差较大。
图二: Small Bias Large variance,数据较为分散,因此方差较大;但是数据都分布在 μ 的周围,因此偏差较小。
2、然后,bias和variance是怎么产生的
首先, 我们不知道实际的model是怎样的,假设实际曲线为 f head,横坐标为 input,纵坐标为 output
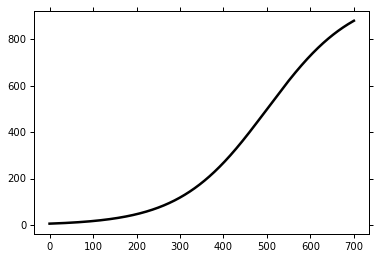
其次, 我们寻找100组training data,每组10个数据(x1,y1)...... (x10, y10)。
我们需要寻找一个最合适的model,使得bias最小。
然后, 建立简单的model 1 —— y = b + w ∙ x
利用100组数据,我们可以有100个 f* 即最优解(w,b的参数不同),得到的100个 f* 如图所示。
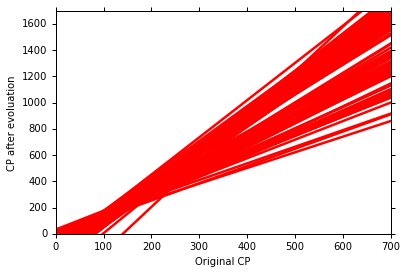
将100个 f* 求取平均值,得到 f(如蓝线所示) 。与实际的 f head 对比。如下图所示

至此便有了 bias 和 variance。
接着,进一步建立更加复杂的model 2 —— y = b + w1 ∙ x + w2 ∙ x2+w3 ∙ x3
同样的重复上述步骤,分别在100组数据中,建立100个 f*,并求取平均值 f。
并于 f haed 对比,即可得出 bias 和 variance。
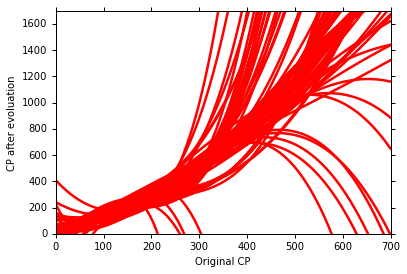
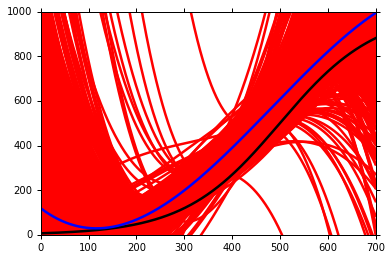
继续,建立更加复杂的model 3 —— y = b + w1 ∙ x + w2 ∙ x2+ w3 ∙ x3 + w4 ∙ x4+w5 ∙ x5
仍然重复上述步骤。
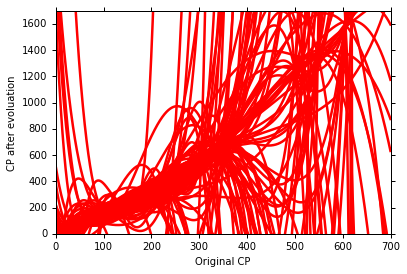
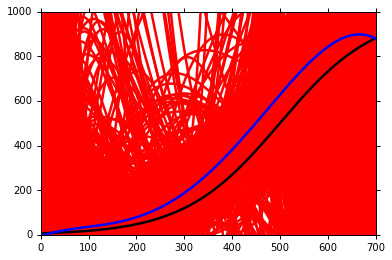
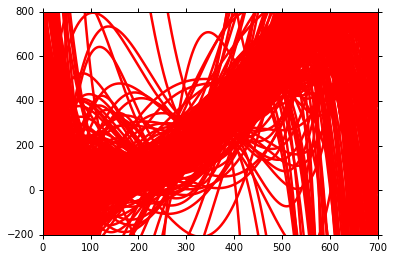
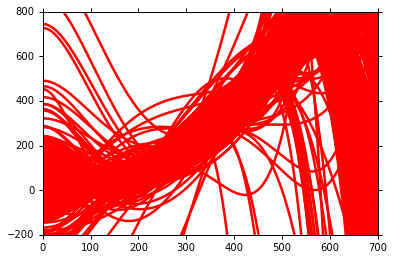
最后,用越来越复杂的model,我们可以得到不同的 model 的 bias 和 variance 。
结论, 可以发现
太简单的model,甚至可能就没包括实际的 f head,因此会造成较大的 bias;
而复杂的model,包含的范围较广,因此也就会用较大的 variance。
我们可以得出结论
随着model越来越复杂, bias 越来越小;variance 越来越大 ;
而我们的目的就是要寻找一个 bias 和 variance 的平衡点。

3、进一步,如何判断我们的model是underfitting还是overfitting?如何解决?
判断:
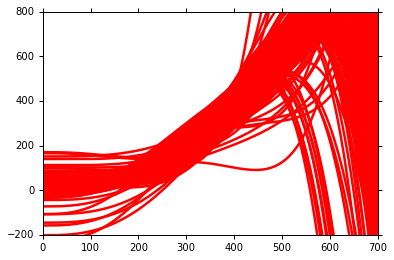
If your model cannot even fit the training examples, then you have large bias —— underfitting
If you can fit the training data, but large error on testing data, then you probably have large variance —— overfitting
解决:
1)underfitting(欠拟合)
1 Add more features as input (在输入中考虑更多的因素)
2 A more complex model(选取使用更加复杂的model)
2)overfitting(过拟合)
1 More data (Very effective, but not always practical )

2 Regularizetion

4、model selection 更好的方法
目标
1)There is usually a trade-off(权衡,协调) between bias and variance
2)Select a model that balances two kinds of error to minimize total error
方法
1)一般方法(不采取)
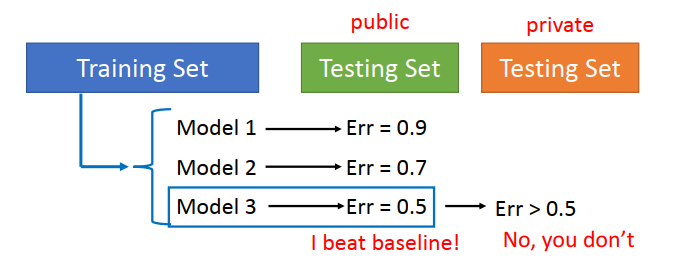
使用 training data 建立多个model,然后用已有的 testing data进行误差测试,选择误差较小的model,然后在位置的testing data中测试发现误差较大。
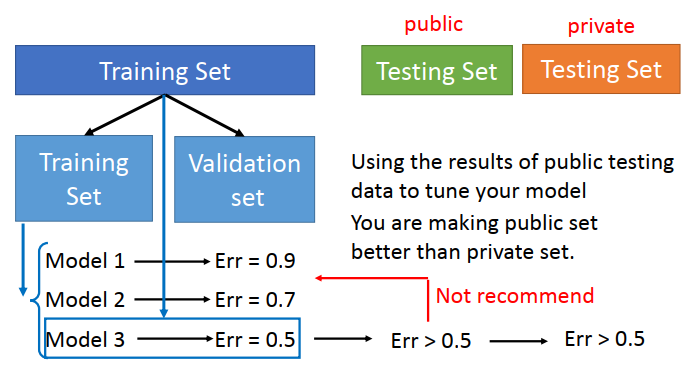
2)方法改进基础Cross Validation(交叉验证)
3)方法改进进阶 N- fold Cross Validation(N倍交叉验证)
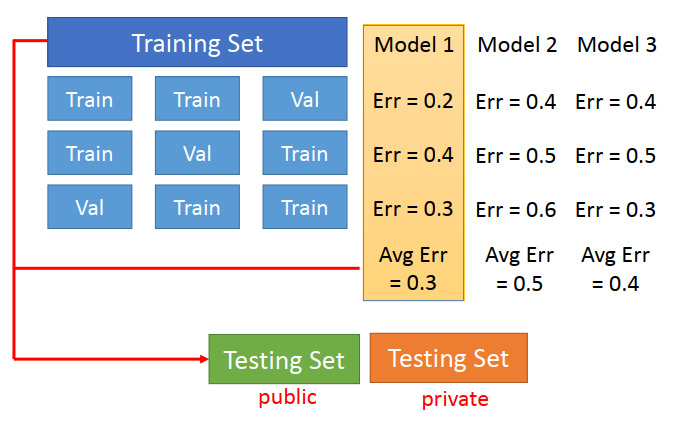
思路同上,将training data分为多组,以三组为例。
选取其中两组作为training data建立多个model,另一组做 test data,得到三个model不同的 error。
重复上次步骤,可到的每个 model 对于不同分组的 error,求取平均值,选取 error 较小的model使用。
5、结论、总结。
后续:分类问题的学习。
𝑓መ


