WPFTookit Chart 入门
如何使用WPFToolKit Chart
1 2 3 4 5 6 7 8 9 10 11 12 13 14 15 16 17 18 19 20 21 22 23 24 25 26 27 28 | private void button1_Click(object sender, EventArgs e){ var s = new Series(); s.ChartType = SeriesChartType.Line; var d = new DateTime(2013, 04, 01); s.Points.AddXY(d, 3); s.Points.AddXY(d.AddMonths(-1), 2); s.Points.AddXY(d.AddMonths(-2), 1); s.Points.AddXY(d.AddMonths(-3), 4); chart1.Series.Clear(); chart1.Series.Add(s); chart1.Series[0].XValueType = ChartValueType.DateTime; chart1.ChartAreas[0].AxisX.LabelStyle.Format = "yyyy-MM-dd"; chart1.ChartAreas[0].AxisX.Interval = 1; chart1.ChartAreas[0].AxisX.IntervalType = DateTimeIntervalType.Months; chart1.ChartAreas[0].AxisX.IntervalOffset = 1; chart1.Series[0].XValueType = ChartValueType.DateTime; DateTime minDate = new DateTime(2013, 01, 01).AddSeconds(-1); DateTime maxDate = new DateTime(2013, 05, 01); // or DateTime.Now; chart1.ChartAreas[0].AxisX.Minimum = minDate.ToOADate(); chart1.ChartAreas[0].AxisX.Maximum = maxDate.ToOADate();} |
或者
1 2 3 4 5 6 7 8 9 10 11 12 13 14 15 16 17 18 19 20 | <charting:Chart x:Name="chtSummary" Width="770" Height="400" Title="My Chart Title"> <charting:Chart.TitleStyle> <Style TargetType="datavis:Title"> <Setter Property="FontSize" Value="28" /> <Setter Property="FontFamily" Value="Arial" /> <Setter Property="Margin" Value="5, 10, 5, 15" /> </Style> </charting:Chart.TitleStyle> <charting:Chart.LegendStyle> <Style TargetType="datavis:Legend"> <Setter Property="Width" Value="0" /> </Style> </charting:Chart.LegendStyle> <charting:Chart.Series> <charting:BarSeries ItemsSource="{Binding}" DependentValuePath="Value" IndependentValuePath="Key" IsSelectionEnabled="True" > <charting:BarSeries.IndependentAxis> <charting:CategoryAxis Orientation="Y" AxisLabelStyle="{StaticResource SummaryChartAxisStyle}" /> </charting:BarSeries.IndependentAxis> </charting:BarSeries> </charting:Chart.Series> </charting:Chart> <!-- See more at: http://mitchelsellers.com/blogs/2011/04/20/wpf-chart-styling-explained.aspx#sthash.EdMcBh2I.dpuf--> |
隐藏Legend
隐藏Chart的Legend
1 2 3 4 5 6 | <chartingToolkit:Chart.LegendStyle> <Style TargetType="Control"> <Setter Property="Width" Value="0" /> <Setter Property="Height" Value="0" /> </Style></chartingToolkit:Chart.LegendStyle> |
隐藏具体Item的legend
1 2 3 4 5 | <charting:LineSeries.LegendItemStyle > <Style TargetType="{x:Type charting:LegendItem}"> <Setter Property="Visibility" Value="Collapsed"/> </Style></charting:LineSeries.LegendItemStyle> |
显示定义横纵坐标
1 2 3 4 5 6 7 8 9 10 11 12 | <Grid Height="800"> <chartingToolkit:Chart Name="lineChart" Title="Pressure over Time" VerticalAlignment="Top" Margin="20,50,20,0" Height="500"> <chartingToolkit:Chart.Axes> <chartingToolkit:LinearAxis Title="Pressure" Orientation="Y" Interval="100" /> <chartingToolkit:LinearAxis Title="Time" Orientation="X" Interval="100" /> </chartingToolkit:Chart.Axes> <chartingToolkit:LineSeries DependentValuePath="Value" IndependentValuePath="Key" ItemsSource="{Binding}" Name="Test" IsSelectionEnabled="True" ClipToBounds="False"> </chartingToolkit:LineSeries> </chartingToolkit:Chart> <Button Width="100" Height="24" Margin="20,556,1058,220" Content="More" Name="Button1" /> </Grid> |
修改横纵坐标
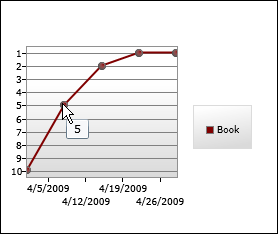
坐标值倒序排列
1 2 3 4 5 6 7 8 9 10 11 12 13 14 15 16 | public class InverterConverter : IValueConverter{ public object Convert(object value, Type targetType, object parameter, CultureInfo culture) { if (value is int) { return -(int)value; } throw new NotImplementedException(); } public object ConvertBack(object value, Type targetType, object parameter, CultureInfo culture) { throw new NotImplementedException(); }} |
1 | |
1 2 3 4 5 6 7 8 9 10 11 12 13 14 15 16 17 18 19 20 21 22 23 24 25 26 27 28 29 | <charting:Chart FontSize="9"> <charting:LineSeries ItemsSource="{Binding}" DependentValueBinding="{Binding Place, Converter={StaticResource InverterConverter}}" IndependentValuePath="Date" Title="Book"> <charting:LineSeries.DataPointStyle> <Style TargetType="charting:LineDataPoint"> <Setter Property="Background" Value="Maroon"/> <Setter Property="DependentValueStringFormat" Value="{}{0:0.#;0.#}"/> </Style> </charting:LineSeries.DataPointStyle> <charting:LineSeries.DependentRangeAxis> <charting:LinearAxis Orientation="Y" Minimum="-10.5" Maximum="-0.5" Interval="1" ShowGridLines="True"> <charting:LinearAxis.AxisLabelStyle> <Style TargetType="charting:AxisLabel"> <Setter Property="StringFormat" Value="{}{0:0.#;0.#}"/> </Style> </charting:LinearAxis.AxisLabelStyle> </charting:LinearAxis> </charting:LineSeries.DependentRangeAxis> </charting:LineSeries></charting:Chart> |
参考 http://dlaa.me/blog/post/9607895
修改ToolTips
1 2 3 4 5 6 7 8 9 | <ToolTipService.ToolTip> <StackPanel> <ContentControl Content="Custom ToolTip" FontWeight="Bold"/> <ContentControl Content="{TemplateBinding FormattedDependentValue}"/> </StackPanel></ToolTipService.ToolTip> |
http://dlaa.me/blog/post/9631686
参考
My new home page, extended [Updated collection of great Silverlight and WPF Charting resources!]
作者:旭东
出处:http://www.cnblogs.com/HQFZ
关于作者:专注于微软平台项目架构、管理和企业解决方案。现主要从事WinForm、ASP.NET、WPF、WCF、等方面的项目开发、架构、管理。如有问题或建议,请不吝指教!
本文版权归作者,欢迎转载,但未经作者同意必须保留此段声明,且在文章页面明显位置给出原文连接。如有问题,可以联系我,非常感谢。
如果您该文觉得不错或者对你有帮助,请点下推荐,让更多的朋友看到,谢谢!


【推荐】国内首个AI IDE,深度理解中文开发场景,立即下载体验Trae
【推荐】编程新体验,更懂你的AI,立即体验豆包MarsCode编程助手
【推荐】抖音旗下AI助手豆包,你的智能百科全书,全免费不限次数
【推荐】轻量又高性能的 SSH 工具 IShell:AI 加持,快人一步
· go语言实现终端里的倒计时
· 如何编写易于单元测试的代码
· 10年+ .NET Coder 心语,封装的思维:从隐藏、稳定开始理解其本质意义
· .NET Core 中如何实现缓存的预热?
· 从 HTTP 原因短语缺失研究 HTTP/2 和 HTTP/3 的设计差异
· 周边上新:园子的第一款马克杯温暖上架
· Open-Sora 2.0 重磅开源!
· 分享 3 个 .NET 开源的文件压缩处理库,助力快速实现文件压缩解压功能!
· Ollama——大语言模型本地部署的极速利器
· DeepSeek如何颠覆传统软件测试?测试工程师会被淘汰吗?