这篇记录的内容来自于Andrew Ng教授在coursera网站上的授课。
1.线性回归不适用于分类问题。
原因:1.单个样本对于线性回归可能会造成很大的影响。
2.函数的输出值可能非常大,非常离谱。
2.逻辑回归(logistic regression):一种分类算法。是广义线性回归,$h(x)=g(\theta^{T}x)$,其中
$g(x)=\frac{1}{1+e^{-x}}$
被称为logistic函数,或sigmoid函数。
3.记号:$h_{\theta}(x)=P(y=1|x;\theta)$,即在theta参数和x的条件下,y等于1的概率。
4.决策边界(decision boundary):$h(x)=0$的解集,这是h函数、参数的属性,而不是数据集的属性。
5.逻辑回归可以像以前特征缩放一样使用多项式,这样就造成其可拟合很多类型的数据集。
6.逻辑回归问题:
h函数,$h_{\theta}{(x)}=\frac{1}{1+e^{-\theta^{T}x}}$
(x(i),y(i))第i样样本,输入为x,输出为y
最小化$\frac{1}{m}\sum{cost(h_{\theta}(x^{(i)}),y^{(i)})}$
可以发现,如果直接使用梯度下降法,非常容易会停留在局部最优值上,因此代价函数不能使用平方误差函数。
而我们的麻烦之处,正在于e次方上,我们便尝试使用对数函数来去掉它的影响。于是代价函数为:
$$cost(h_{\theta}(x),y)=\begin{cases}-log(h_{\theta}(x))if\quad y=1\\-log(1-h_{\theta}(x))if\quad y=0\end{cases}$$
条件不要搞反了。
为什么?
于是,$$J(\theta)=\frac{1}{m}\sum_{i=1}^{m}{-y*log(h_{\theta}(x))-(1-y)log(1-h_{\theta}(x))}$$
$$=-\frac{1}{m}\sum_{i=1}^{m}{y*log(h_{\theta}(x))+(1-y)log(1-h_{\theta}(x))}$$
我们知道,线性回归梯度下降的公式为$$\theta_{i}:=\theta_{i}-\alpha\sum_{j=1}^{m}{(h_{\theta}(x^{(j)})-y^{(j)})}x^{(j)}_{i}$$
对逻辑回归的误差函数求一下导,发现:
傻眼了吧?就是线性回归的式子。
7.多元逻辑回归(multi-class classification,one-vs-rest):用n个分类器。
8.除了线性回归以外,别想着自己亲手写出正确的、优秀的、高效的算法了。好好使用前人已经花费了心血的库。
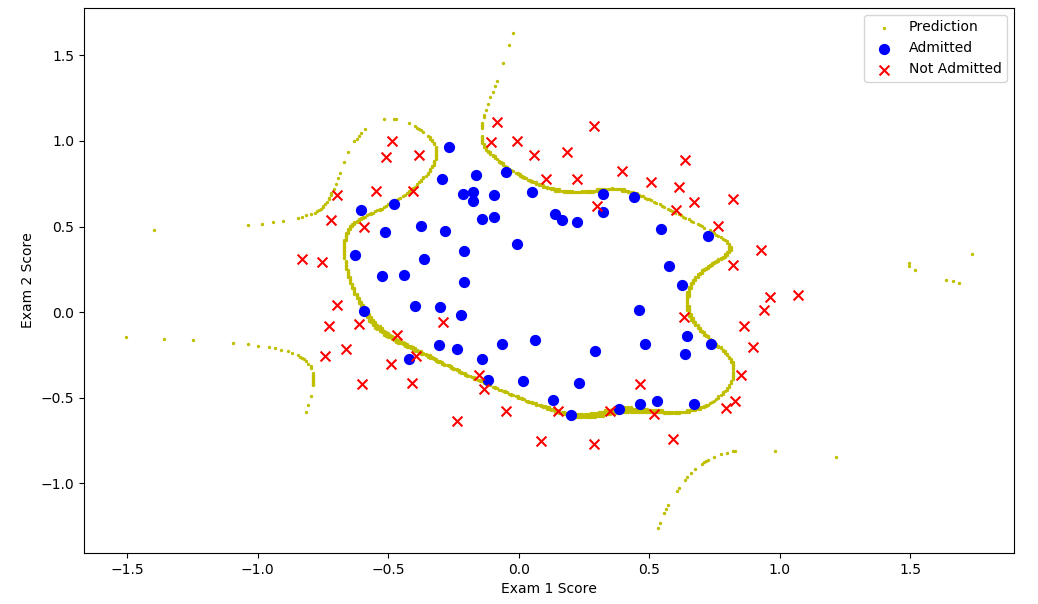
1.欠拟合(underfitting):不能很好拟合训练数据。
2.过拟合(overfitting):很好地拟合了训练数据,但过度依赖,导致方差过大,实际预测效果很差。
3.正则化线性回归:$$J_{\theta}(x)=\frac{1}{2m}(\sum_{i=1}^{m}{(h_{\theta}(x^{(i)})-y^{(i)})^2}+\lambda\sum_{i=1}^{n}{\theta_i^2})$$
不对$\theta_0$加以限制,这是传统。
能够调次数、均值归一化的双元、一对一逻辑回归:

  1 import numpy as np
  2 import pandas as pd
  3 import matplotlib.pyplot as plt
  4 import math
  5 import scipy.optimize as opt
  6
  7 ######################################################################sigmoid函数
  8 def sigmoid(x):
  9     return (1/(1+np.exp(-x)))
 10 ######################################################################代价
 11 def cost(theta,x,y):
 12     theta=np.matrix(theta)
 13     x=np.matrix(x)
 14     y=np.matrix(y)
 15     first=np.multiply(-y,np.log(sigmoid(x*theta.T)))
 16     second=np.multiply(1-y,np.log(1-sigmoid(x*theta.T)))
 17     return np.sum(first-second)/len(x)
 18 ######################################################################更新函数
 19 def gradient(theta,x,y):
 20     theta=np.matrix(theta)
 21     x=np.matrix(x)
 22     y=np.matrix(y)
 23     n=x.shape[1]
 24     error=sigmoid(x*theta.T)-y
 25     G=np.zeros(n)
 26     for i in range(n):
 27         temp=np.multiply(error,x[:,i])
 28         G[i]=np.sum(temp)/len(x)
 29     return G
 30 ######################################################################决策边界
 31 def findBoundary(theta,type,mean,len):
 32     Len=500
 33     t1=np.linspace(-2,2,Len)
 34     t2=np.linspace(-2,2,Len)
 35     X=[]
 36     Y=[]
 37     n=theta[0].shape[0]
 38     for i in range(Len):
 39         for j in range(Len):
 40             sum=theta[0][0]
 41             x=t1[i]
 42             y=t2[j]
 43             for k in range(1,n):
 44                 sum+=(math.pow(x,type[k-1,0])*math.pow(y,type[k-1,1])-mean[k])*theta[0][k]/len[k]
 45             if(abs(sum)<=0.1):
 46                 X.append(t1[i])
 47                 Y.append(t2[j])###y特征没特征缩放
 48     return X,Y
 49 ######################################################################绘图
 50 def plotData(positive,negative,theta,type,mean,len):
 51     x,y=findBoundary(theta,type,mean,len)
 52     fig, ax = plt.subplots(figsize=(12,8))
 53     ax.scatter(x,y,c="y",s=2,label="Prediction")
 54     ax.scatter(positive['Exam 1'], positive['Exam 2'], s=50, c='b', marker='o', label='Admitted')
 55     ax.scatter(negative['Exam 1'], negative['Exam 2'], s=50, c='r', marker='x', label='Not Admitted')
 56     ax.legend()
 57     ax.set_xlabel('Exam 1 Score')
 58     ax.set_ylabel('Exam 2 Score')
 59     plt.show()
 60 ######################################################################处理数据
 61 def dataProcess(data,type):
 62     x=data.iloc[:,0]
 63     y=data.iloc[:,1]
 64     n=type.shape[0]
 65     data2=pd.DataFrame(np.zeros((data.shape[0],n)))
 66     mean=np.zeros(n+2)
 67     len=np.zeros(n+2)
 68     for i in range(n):
 69         now=np.power(x,type[i,0])*np.power(y,type[i,1])
 70         mean[i+1]=np.mean(now)
 71         len[i+1]=now.max()-now.min()+1
 72         now=(now-mean[i+1])/len[i+1]
 73         data2[i]=now
 74     now=data.iloc[:,2]
 75     mean[n+1]=0###这里不能特征缩放!!!
 76     len[n+1]=1
 77     data2[n]=data.iloc[:,2]
 78     mean[0]=1
 79     len[0]=1
 80     data2.insert(0,"Ones",1)
 81     return data2,mean,len
 82 ######################################################################主函数
 83 def main():
 84     path="ex2data2.txt"
 85     G=[]
 86     for i in range(0,5):
 87         for j in range(0,5):
 88             G.append([i,j])
 89     type=np.matrix(G)
 90     source=pd.read_csv(path,header=None,names=['Exam 1','Exam 2','Admitted'])
 91     data,mean,len=dataProcess(source,type)
 92     m=data.shape[0]
 93     n=data.shape[1]
 94     x=np.matrix(data.iloc[:,0:n-1])
 95     y=np.matrix(data.iloc[:,n-1:n])
 96     theta=np.zeros(n-1)
 97     vector=opt.fmin_tnc(func=cost,x0=theta,fprime=gradient,args=(x,y))
 98 ###                        误差函数  初值     更新函数        样本
 99     print(vector)
100     plotData(source[source["Admitted"].isin([1])],source[source["Admitted"].isin([0])],vector,type,mean,len)
101 ######################################################################
102 if __name__=="__main__":
103     main()

过拟合:


 posted on

 浙公网安备 33010602011771号