LaTeX图片环境 Picture environment
2016-06-15 21:09 GarfieldEr007 阅读(1201) 评论(0) 编辑 收藏 举报Picture environment
If you need to include simple diagrams or figures in your document, the picture environment may be helpful. This article describes circles, lines, and other graphic elements created with LATEX.
Contents |
Introduction
Images can be "programmed" directly in your LATEX file
\setlength{\unitlength}{1cm}
\thicklines
\begin{picture}(10,6)
\put(2,2.2){\line(1,0){6}}
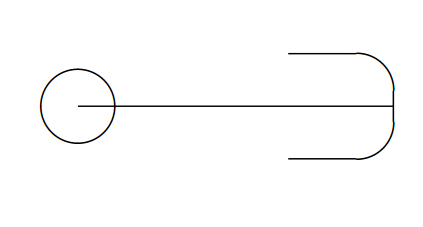
\put(2,2.2){\circle{2}}
\put(6,2.2){\oval(4,2)[r]}
\end{picture}
The syntax of the picture is
\begin{picture}(width,height)(x-offset,y-offset)
the parameters are passed inside parentheses, width and height as you may expect, determine the width and the height of the picture; the units for this parameter are set by \setlength{\unitlength}{1cm}. The second parameter is optional and establishes the coordinates for the lower-left corner. Below a description of other commands:
\put(6,2.2){\oval(4,2)[r]}- will draw a oval centred in the point
4,2. The parameter[r]is optional, you can use r, l, t and b to show the right, left, top or bottom part of the oval. If absent the whole oval is drawn.
\put(2,2.2){\circle{2}}- draws a circle centred at the point (2,2.2) and whose diameter is 2.
In the next section the rest of the commands are described.
Open an example the picture environment in ShareLaTeX
Combining lines, circles and text
Different basic elements can be combined for more complex pictures
\setlength{\unitlength}{0.8cm}
\begin{picture}(12,4)
\thicklines
\put(8,3.3){{\footnotesize $3$-simplex}}
\put(9,3){\circle*{0.1}}
\put(8.3,2.9){$a_2$}
\put(8,1){\circle*{0.1}}
\put(7.7,0.5){$a_0$}
\put(10,1){\circle*{0.1}}
\put(9.7,0.5){$a_1$}
\put(11,1.66){\circle*{0.1}}
\put(11.1,1.5){$a_3$}
\put(9,3){\line(3,-2){2}}
\put(10,1){\line(3,2){1}}
\put(8,1){\line(1,0){2}}
\put(8,1){\line(1,2){1}}
\put(10,1){\line(-1,2){1}}
\end{picture}
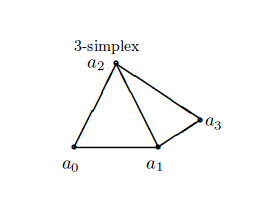
In this example several lines and circles are combined to create a picture, then some text is added to label the points. Below each command is explained:
\thicklines- This changes the thickness of the lines, making them a bit thicker, you can also use
\thinlineswhich has the opposite effect.
\put(8,3.3){{\footnotesize $3$-simplex}}- The text "3-simplex" is inserted at the point (8,3.3), the font size is set to footnotesize. The same command is used to label each point.
\put(9,3){\circle*{0.1}}- This draws a filled circle centred at (9,3) and it's diameter is 0.1. Is so small that is used as a point.
\put(10,1){\line(3,2){1}}
- Draws a straight line, whose start point is at (10,1), it's length is 1 and it's direction is (3,2). As you see lines with arbitrary slopes are tricky to draw, some calculations must be performed for this.
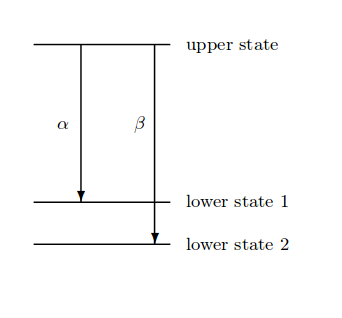
Arrows can also be used inside a picture environment, let's see a second example
\setlength{\unitlength}{0.20mm}
\begin{picture}(400,250)
\put(75,10){\line(1,0){130}}
\put(75,50){\line(1,0){130}}
\put(75,200){\line(1,0){130}}
\put(120,200){\vector(0,-1){150}}
\put(190,200){\vector(0,-1){190}}
\put(97,120){$\alpha$}
\put(170,120){$\beta$}
\put(220,195){upper state}
\put(220,45){lower state 1}
\put(220,5){lower state 2}
\end{picture}
The syntax for vectors the same used for line
\put(120,200){\vector(0,-1){150}}- This renders a vector whose start point is (120,200), its length is 150 and the direction is (0,-1).
Open an example the picture environment in ShareLaTeX
Bézier curves
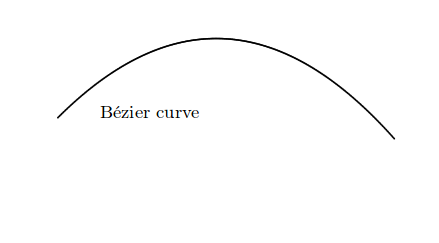
Bézier curves are special curves that are drawn using three parameters, one start point, one end point and a control point that determines "how curved" it is.
\setlength{\unitlength}{0.8cm}
\begin{picture}(10,5)
\thicklines
\qbezier(1,1)(5,5)(9,0.5)
\put(2,1){{Bézier curve}}
\end{picture}
Notice that the command \qbezier (quadratic Bezier curve) is not inside a \put command. The parameters that must be passed are:
- A start point,
- A control point and
- An endpoint.
Picture is the standard tool to create figures in LATEX, as you see this is tool is sometimes too restrictive and cumbersome to work with, but it's supported by most of the compilers and no extra packages are needed. If you need to create complex figures, for more suitable and powerful tools see the TikZ package andPgfplots package articles.
Open an example the picture environment in ShareLaTeX
from: https://www.sharelatex.com/learn/Picture_environment


