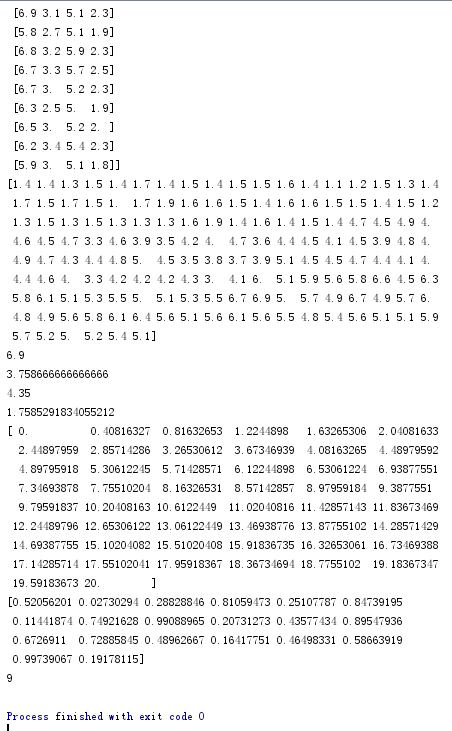
#计算数组的最大值,最小值,平均值,标准差,中位数
import numpy as np
a=np.random.random(20)
print(np.max(a))
print(np.min(a))
print(np.mean(a))
print(np.std(a))
print(np.median(a))
#计算鸢尾花花瓣长度的最大值,平均值,中值,均方差
from sklearn.datasets import load_iris
data=load_iris()
print('data类型:',type(data))
##包含哪些数据
print('数据:',data.keys(),data.feature_names)
iris=data.data
print(iris)
petal_length=iris[:,2]
print(petal_length)
#最大值
print(np.max(petal_length))
#平均值
print(np.mean(petal_length))
#中值
print(np.median(petal_length))
#均方差
print(np.std(petal_length))
print(np.linspace(0,20))
print(np.random.random(20))
print(np.random.randint(20))
#numpy随机数
np.arange(5)
list(range(5))
#np.array([a,b])
np.arange(0,60,5).reshape(3,4)
#在指定的间隔内返回均匀间隔的数字。
np.linspace(0,20)
#(0,1)以内10个随机浮点数
np.random.random(10)
#(1,100)以内的5行5列随机整数
np.random.randint(1,100,[5,5])
#产生2行3列均匀分布随机数组
np.random.rand(2,3)
#3行3列正态分布随机数据
np.random.randn(3,3)

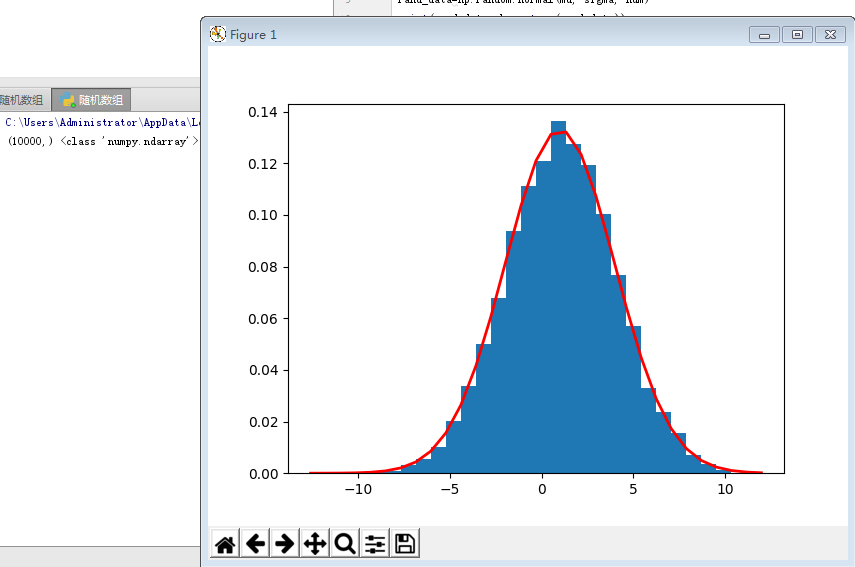
#用np.random.normal()产生一个正态分布的随机数组,并显示出来。
import numpy as np
import matplotlib.pyplot as plt
#期望为1
mu=1
#标准差为3
sigma=3
#个数为10000
num=10000
rand_data=np.random.normal(mu, sigma, num)
print(rand_data.shape,type(rand_data))
count,bins,ignored=plt.hist(rand_data, 30, normed=True)
plt.plot(bins,1/(sigma*np.sqrt(2*np.pi))*np.exp( - (bins - mu)**2/(2*sigma**2)),linewidth=2,color='r')
plt.show()
import numpy as np
import matplotlib.pyplot as plt
#np.random.randn()产生一个正态分布的随机数组,并显示出来。
np.random.randn(3,3)
plt.show()
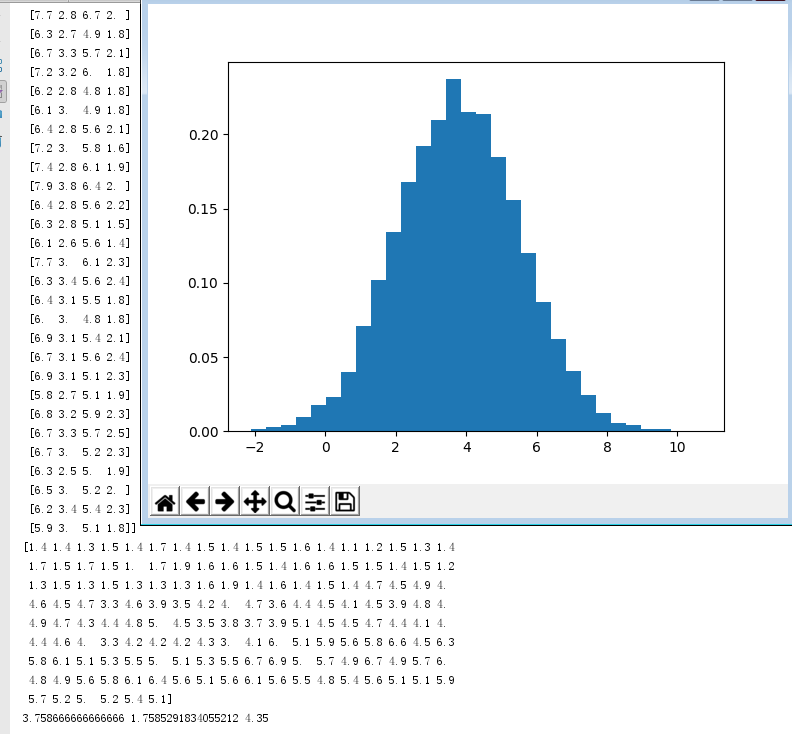
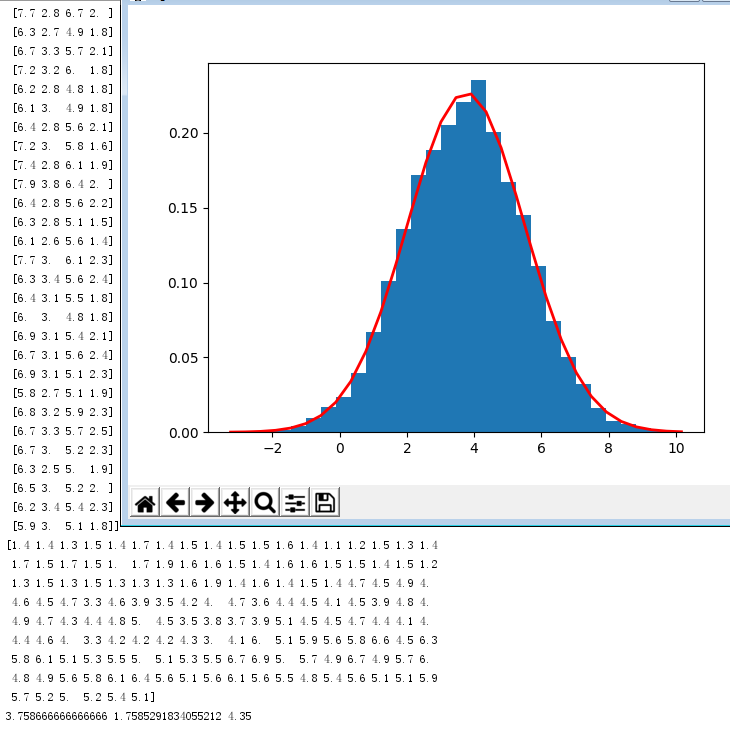
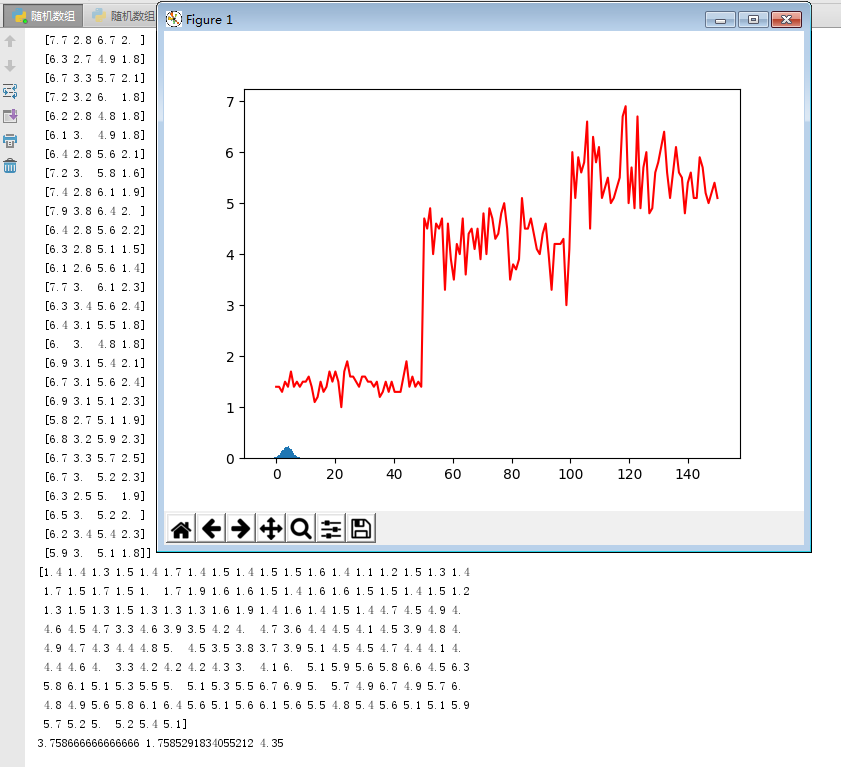
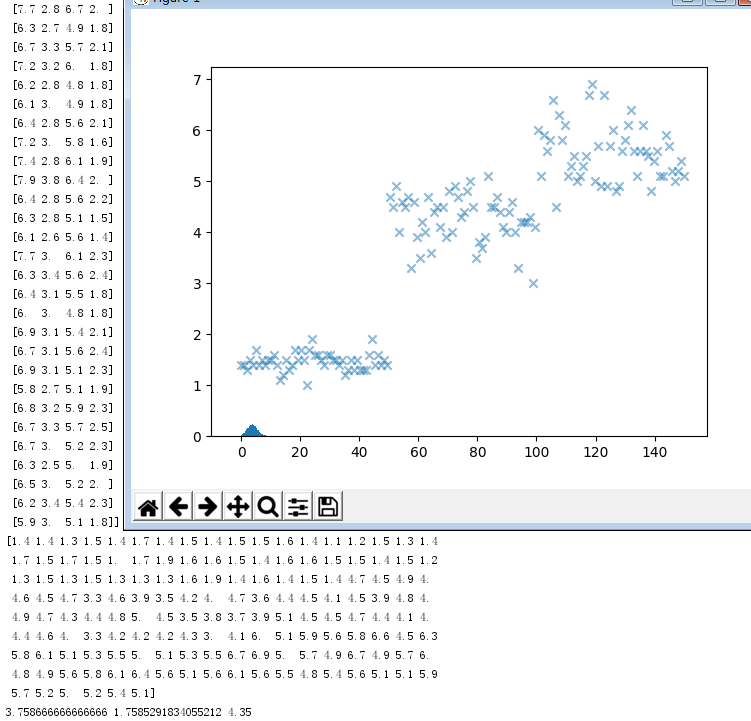
#显示鸢尾花花瓣长度的正态分布图,曲线图,散点图。
from sklearn.datasets import load_iris
data=load_iris()
iris=data.data
print(iris)
petal_length=iris[:,2]
print(petal_length)
#期望
mu=np.mean(petal_length)
#标准差
sigma=np.std(petal_length)
num=10000
rand_data=np.random.normal(mu, sigma, num)
print(np.mean(petal_length),np.std(petal_length),np.median(petal_length))
count,bins,ignored=plt.hist(rand_data, 30, normed=True)
#plt.plot(bins,1/(sigma*np.sqrt(2*np.pi))*np.exp( - (bins - mu)**2/(2*sigma**2)),linewidth=2,color='r')
#plt.plot(np.linspace(0,150,num=150),petal_length,"r")
#plt.scatter(np.linspace(0,150,num=150),petal_length,alpha=0.5,marker="x")
plt.show()
import numpy as np
import matplotlib.pyplot as plt
x=np.linspace(0,50)
y=x**2
plt.plot(x,y,'mD')
plt.show()
import numpy as np
import matplotlib.pyplot as plt
t=np.arange(0.,1.,0.02)
plt.plot(t,sin(t),'r--',t,t**3,'b^'t,t**2,'gs')
plt.show()

