
python matplotlib 库学习
基本使用
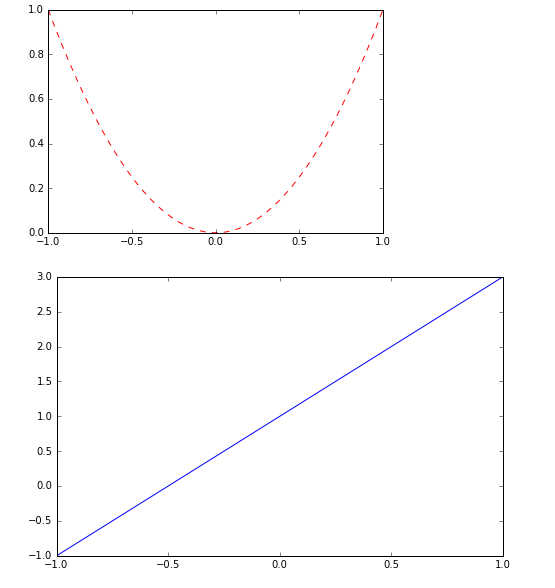
import matplotlib.pyplot as plt
import numpy as np

x = np.linspace(-1,1,50)
y = 2*x+1
plt.figure(num=2,figsize=(8,5))
plt.plot(x,y)

plt.figure(num=1)
y2 = x**2
plt.plot(x,y2,color='red',linewidth=1.0,linestyle='--')  # 默认 线宽为1
plt.show()
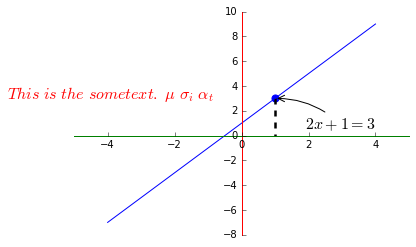
感受一波被繁多参数支配的恐惧
import matplotlib.pyplot as plt
import numpy as np

x = np.linspace(-4,4,10)
y = 2*x+1

ax = plt.gca()
ax.spines['top'].set_color('none')
ax.spines['right'].set_color('none')

xaxis = ax.xaxis
yaxis = ax.yaxis
xaxis.set_ticks_position('bottom')
yaxis.set_ticks_position('left')


left_ax = ax.spines['left']
bottom_ax = ax.spines['bottom']
left_ax.set_color('red')
bottom_ax.set_color('green')

left_ax.set_position(('data',0))
bottom_ax.set_position(('data',0))


x0 = 1
y0 = 2*x0+1
plt.scatter(x0,y0,s=50,color='b')

plt.plot([x0,x0],[y0,0],'k--',linewidth=2.5)
plt.annotate(r'$2x+1=%s$' %y0,xy=(x0,y0),xycoords='data',xytext=(+30,-30),textcoords='offset points',fontsize=16,arrowprops=dict(arrowstyle='->',connectionstyle='arc3,rad=.2'))
plt.text(-7,3,r'$This\ is\ the\ some text.\ \mu\ \sigma_i\ \alpha_t $',fontdict={'size':16,'color':'red'})
plt.plot(x,y,color='b')
plt.show()
如果有来生,一个人去远行,看不同的风景,感受生命的活力。。。

 浙公网安备 33010602011771号