

prometheus监控golang服务实践
一、prometheus基本原理介绍
prometheus是基于metric采样的监控,可以自定义监控指标,如:服务每秒请求数、请求失败数、请求执行时间等,每经过一个时间间隔,数据都会从运行的服务中流出,存储到一个时间序列数据库中,之后可通过PromQL语法查询。
主要特点:
多维数据模型,时间序列数据通过metric名以key、value的形式标识;
使用PromQL语法灵活地查询数据;
不需要依赖分布式存储,各服务器节点是独立自治的;
时间序列的收集,通过 HTTP 调用,基于pull 模型进行拉取;
通过push gateway推送时间序列;
通过服务发现或者静态配置,来发现目标服务对象;
多种绘图和仪表盘的可视化支持;
二、prometheus使用docker部署
查看是否有镜像
sudo docker search prometheus
新建prometheus.yaml
global:
scrape_interval: 10s
evaluation_interval: 60s


scrape_configs:
- job_name: prometheus
static_configs:
- targets: ['localhost:9090']
- job_name: integral
static_configs:
- targets: ['10.20.xx.xx:8001']
执行:
docker run --name prometheus -p 9090:9090 -v ~/prometheus.yaml:/etc/prometheus/prometheus.yml prom/prometheus
进入容器中可以看到配置文件已映射到容器指定目录:

踩坑: prometheus官方镜像指定的配置文件是prometheus.yml 所以映射到容器内的文件名一定要保持一致 否则会出现指定的配置文件不生效
三、prometheus整体架构及各组件
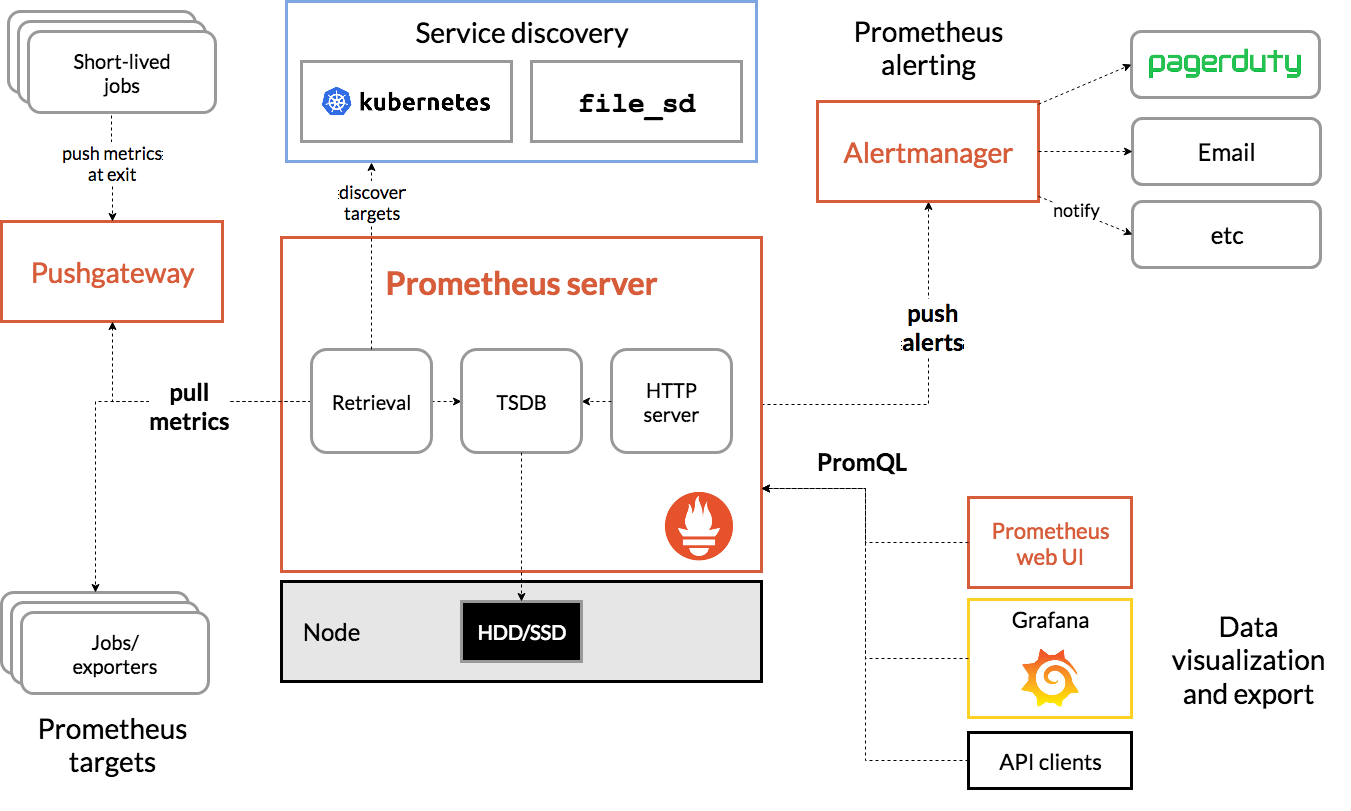
Prometheus Server :主程序,负责抓取和存储时序数据;
Client Libraries:客户端库,负责检测应用程序代码;
Push Gateway:Push 网关,接收短生命周期的 Job 主动推送的时序数据;
Exporters:为不同服务定制的Exporter(如:HAProxy、StatsD、Graphite等) ,从而抓取它们的Metris指标数据;
Alert Manage:告警管理器,处理不同的告警;
四、prometheus客户端调用示例
自定义prometheus的gin中间件
package ginprometheus

import (
	"strconv"
	"sync"
	"time"

	"github.com/gin-gonic/gin"
	"github.com/prometheus/client_golang/prometheus"
)

const (
	metricsPath = "/metrics"
	faviconPath = "/favicon.ico"
)

var (
	// httpHistogram prometheus 模型
	httpHistogram = prometheus.NewHistogramVec(prometheus.HistogramOpts{
		Namespace:   "http_server",
		Subsystem:   "",
		Name:        "requests_seconds",
		Help:        "Histogram of response latency (seconds) of http handlers.",
		ConstLabels: nil,
		Buckets:     nil,
	}, []string{"method", "code", "uri"})
)

// init 初始化prometheus模型
func init() {
	prometheus.MustRegister(httpHistogram)
}

// handlerPath 定义采样路由struct
type handlerPath struct {
	sync.Map
}

// get 获取path
func (hp *handlerPath) get(handler string) string {
	v, ok := hp.Load(handler)
	if !ok {
		return ""
	}
	return v.(string)
}

// set 保存path到sync.Map
func (hp *handlerPath) set(ri gin.RouteInfo) {
	hp.Store(ri.Handler, ri.Path)
}

// GinPrometheus gin调用Prometheus的struct
type GinPrometheus struct {
	engine  *gin.Engine
	ignored map[string]bool
	pathMap *handlerPath
	updated bool
}

type Option func(*GinPrometheus)

// Ignore 添加忽略的路径
func Ignore(path ...string) Option {
	return func(gp *GinPrometheus) {
		for _, p := range path {
			gp.ignored[p] = true
		}
	}
}

// New new gin prometheus
func New(e *gin.Engine, options ...Option) *GinPrometheus {
	if e == nil {
		return nil
	}

	gp := &GinPrometheus{
		engine: e,
		ignored: map[string]bool{
			metricsPath: true,
			faviconPath: true,
		},
		pathMap: &handlerPath{},
	}

	for _, o := range options {
		o(gp)
	}
	return gp
}

// updatePath 更新path
func (gp *GinPrometheus) updatePath() {
	gp.updated = true
	for _, ri := range gp.engine.Routes() {
		gp.pathMap.set(ri)
	}
}

// Middleware set gin middleware
func (gp *GinPrometheus) Middleware() gin.HandlerFunc {
	return func(c *gin.Context) {
		if !gp.updated {
			gp.updatePath()
		}
		// 过滤请求
		if gp.ignored[c.Request.URL.String()] {
			c.Next()
			return
		}

		start := time.Now()
		c.Next()

		httpHistogram.WithLabelValues(
			c.Request.Method,
			strconv.Itoa(c.Writer.Status()),
			gp.pathMap.get(c.HandlerName()),
		).Observe(time.Since(start).Seconds())
	}
}
gin路由初始化prometheus,使用中间件采样
gp := ginprometheus.New(r)
r.Use(gp.Middleware())
// metrics采样
r.GET("/metrics", gin.WrapH(promhttp.Handler()))
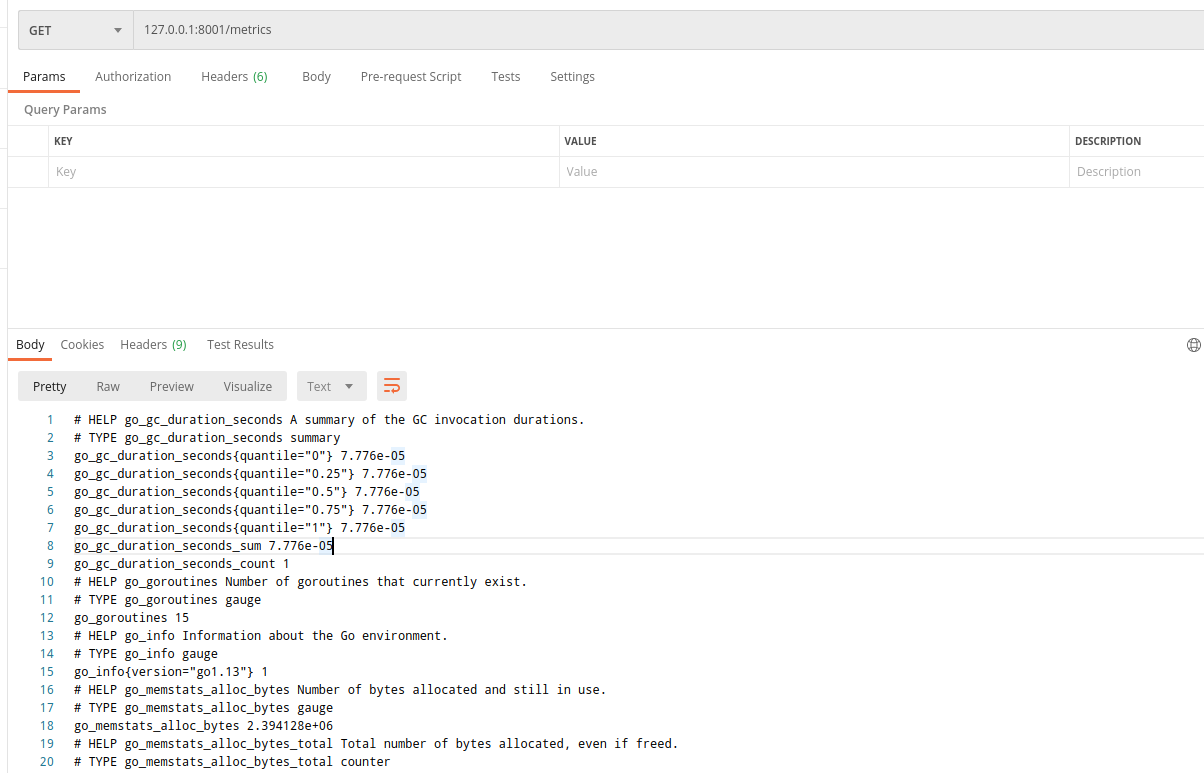
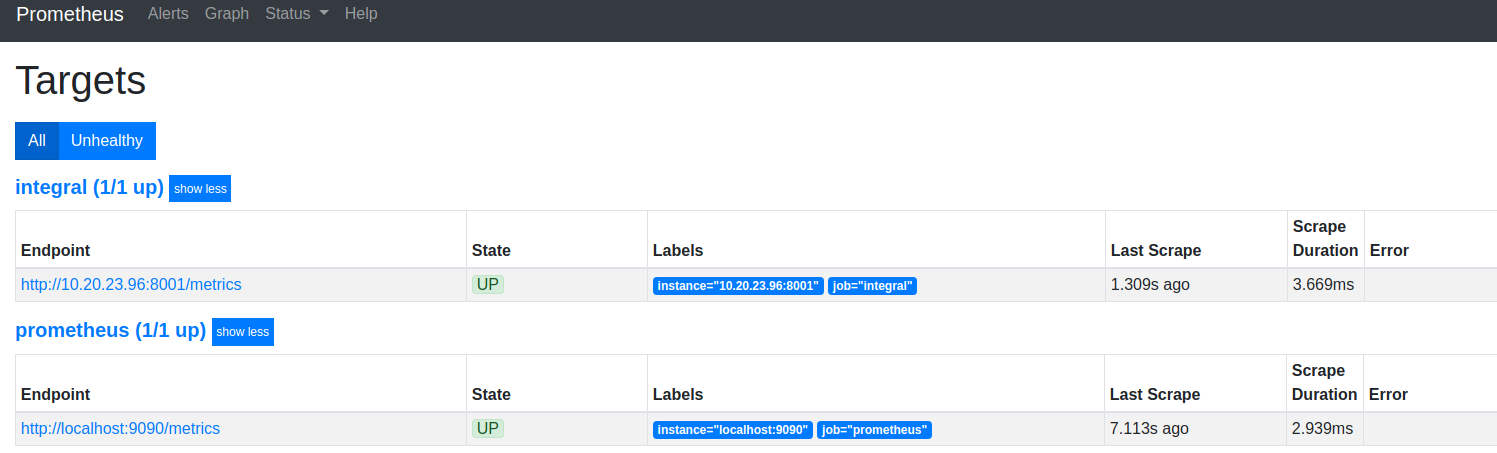
查看target
选取指标对应的graph,这里以gc采样的时间为例:
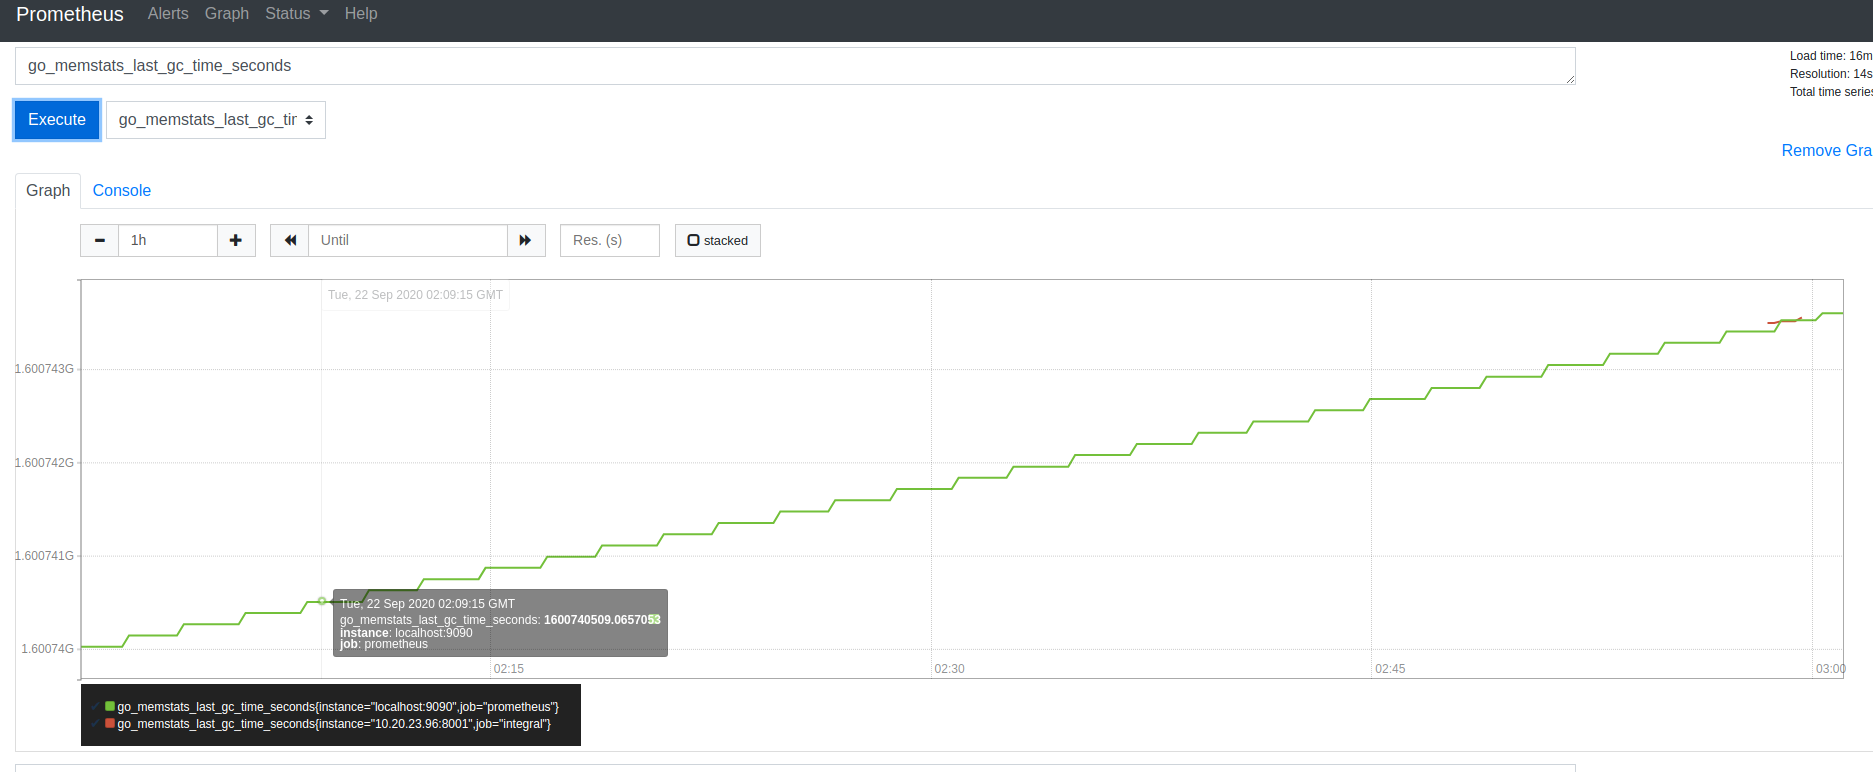
如果需要展示更为丰富的可视化看板,可以将prometheus与grafana结合,将prometheus数据接入到grafana中,此处不再过多阐述

 浙公网安备 33010602011771号