机器学习week9 ex8 review
机器学习week9 ex8 review
这周学习异常监测, 第一部分完成对一个网络中故障的服务器的监测。第二部分使用协同过滤来实现一个电影推荐系统。
1 Anomaly Detection
监测服务器工作状态的指标:吞吐量(throughput)、延迟(latency)。
我们有 的无标签数据集,这里认为其中绝大多数都是正常工作的服务器,其中少量是异常状态。
先通过散点图来直观判断。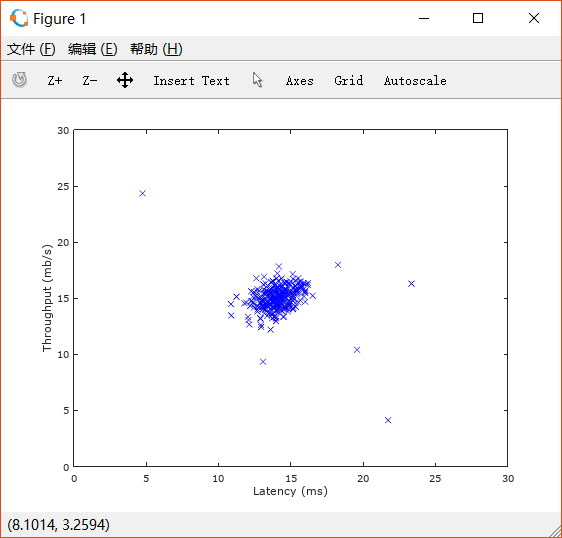
1.1 Gaussian distribution
对数据的分布情况选择一个模型。
高斯分布的公式如下: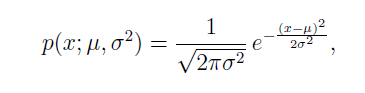
其中 是平均值,
是标准差。
1.2 Estimating parameters for Gaussian distribution
根据如下公式计算高斯分布的参数: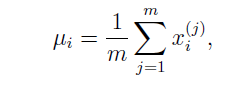
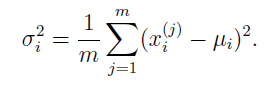
完成estimateGaussian.m如下:
function [mu sigma2] = estimateGaussian(X)
%ESTIMATEGAUSSIAN This function estimates the parameters of a
%Gaussian distribution using the data in X
%   [mu sigma2] = estimateGaussian(X),
%   The input X is the dataset with each n-dimensional data point in one row
%   The output is an n-dimensional vector mu, the mean of the data set
%   and the variances sigma^2, an n x 1 vector
%

% Useful variables
[m, n] = size(X);

% You should return these values correctly
mu = zeros(n, 1);
sigma2 = zeros(n, 1);

% ====================== YOUR CODE HERE ======================
% Instructions: Compute the mean of the data and the variances
%               In particular, mu(i) should contain the mean of
%               the data for the i-th feature and sigma2(i)
%               should contain variance of the i-th feature.
%

mu = mean(X);
sigma2 = var(X,1); % choose the way to divide by N rather than N-1


% =============================================================

end
完成之后,脚本文件会执行绘制等高线的操作,即得到如下图像: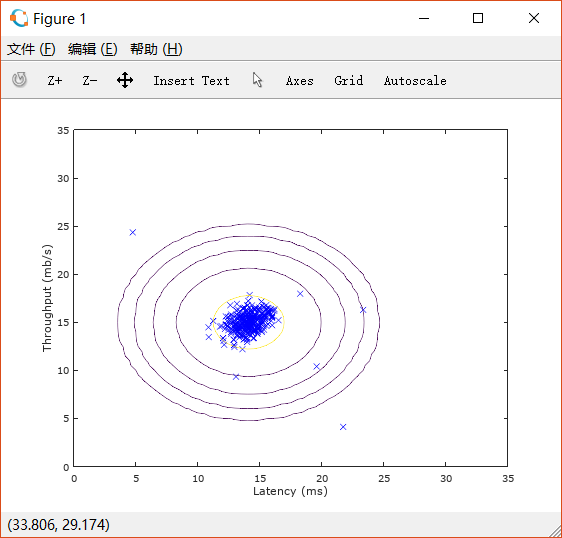
1.3 Selecting the threshold ![\epsilon]()
以 为临界值,
的情况被认为是异常状况。
通过交叉验证集来选择这样的 。
交叉验证集中的数据是带标签的。根据之前学到的 来评价选择的优劣。
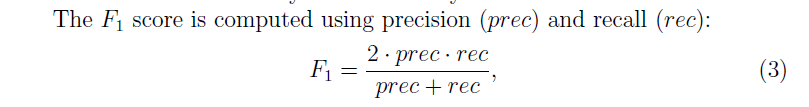
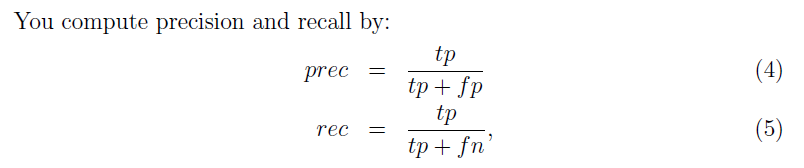
其中 分别代表true positive,false positive, false negative。
function [bestEpsilon bestF1] = selectThreshold(yval, pval)
%SELECTTHRESHOLD Find the best threshold (epsilon) to use for selecting
%outliers
%   [bestEpsilon bestF1] = SELECTTHRESHOLD(yval, pval) finds the best
%   threshold to use for selecting outliers based on the results from a
%   validation set (pval) and the ground truth (yval).
%

bestEpsilon = 0;
bestF1 = 0;
F1 = 0;

stepsize = (max(pval) - min(pval)) / 1000;
for epsilon = min(pval):stepsize:max(pval)

    % ====================== YOUR CODE HERE ======================
    % Instructions: Compute the F1 score of choosing epsilon as the
    %               threshold and place the value in F1. The code at the
    %               end of the loop will compare the F1 score for this
    %               choice of epsilon and set it to be the best epsilon if
    %               it is better than the current choice of epsilon.
    %
    % Note: You can use predictions = (pval < epsilon) to get a binary vector
    %       of 0's and 1's of the outlier predictions

    prediction = (pval < epsilon);
    tp = sum((prediction == 1) & (yval == 1));     % true positive
    fp = sum((prediction == 1) & (yval == 0));     % false positive
    fn = sum((prediction == 0) & (yval == 1));     % false negative
    prec = tp / (tp + fp);                         % precision
    rec = tp / (tp + fn);                          % recall
    F1 = 2 * prec * rec/ (prec + rec);             % F1


    % =============================================================

    if F1 > bestF1
       bestF1 = F1;
       bestEpsilon = epsilon;
    end
end

end
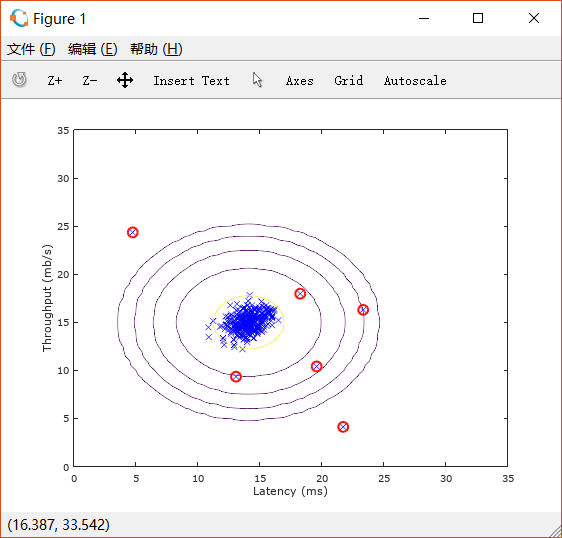
按照选定的 ,判断异常情况如下图:
1.4 High dimensional Dataset
对上述函数,换用更高维的数据集。(11 features)
与之前2维的情况并没有什么区别。
2 Recommender system
对关于电影评分的数据集使用协同过滤算法,实现推荐系统。
Datasets来源:MoiveLens 100k Datasets.
对矩阵可视化: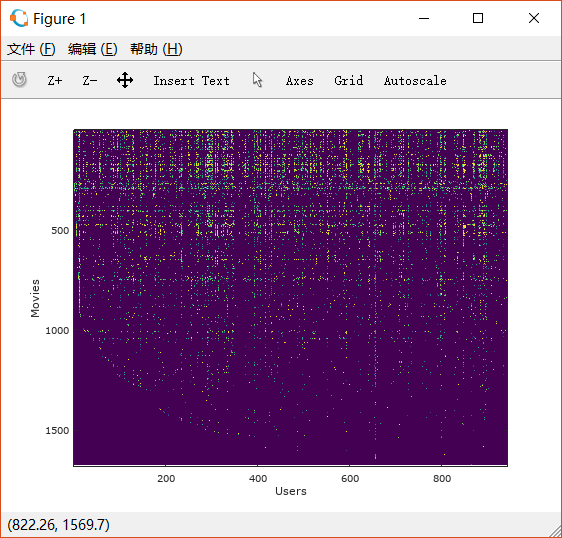
作为对比,四阶单位矩阵可视化情况如下: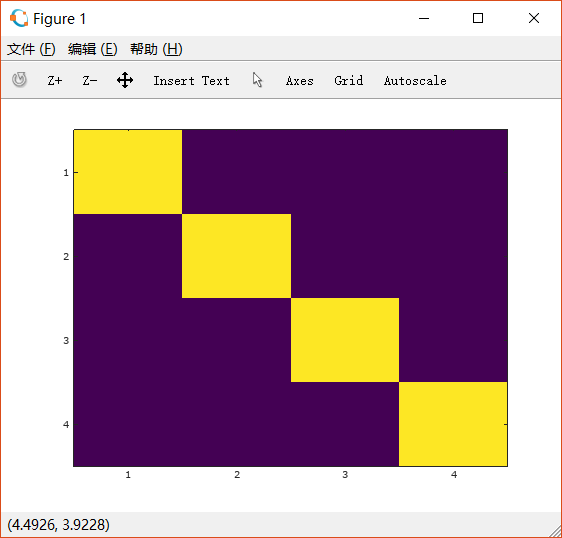
2.1 Movie rating dataset
矩阵 (大小为num_movies
num_users);
矩阵 (
表示电影
被用户
评分过).
2.2 Collaborating filtering learning algorithm
整个2.2都是对cofiCostFunc.m的处理。
原文件中提供的代码如下:
function [J, grad] = cofiCostFunc(params, Y, R, num_users, num_movies, ...
                                  num_features, lambda)
%COFICOSTFUNC Collaborative filtering cost function
%   [J, grad] = COFICOSTFUNC(params, Y, R, num_users, num_movies, ...
%   num_features, lambda) returns the cost and gradient for the
%   collaborative filtering problem.
%

% Unfold the U and W matrices from params
X = reshape(params(1:num_movies*num_features), num_movies, num_features);
Theta = reshape(params(num_movies*num_features+1:end), ...
                num_users, num_features);


% You need to return the following values correctly
J = 0;
X_grad = zeros(size(X));
Theta_grad = zeros(size(Theta));

% ====================== YOUR CODE HERE ======================
% Instructions: Compute the cost function and gradient for collaborative
%               filtering. Concretely, you should first implement the cost
%               function (without regularization) and make sure it is
%               matches our costs. After that, you should implement the
%               gradient and use the checkCostFunction routine to check
%               that the gradient is correct. Finally, you should implement
%               regularization.
%
% Notes: X - num_movies  x num_features matrix of movie features
%        Theta - num_users  x num_features matrix of user features
%        Y - num_movies x num_users matrix of user ratings of movies
%        R - num_movies x num_users matrix, where R(i, j) = 1 if the
%            i-th movie was rated by the j-th user
%
% You should set the following variables correctly:
%
%        X_grad - num_movies x num_features matrix, containing the
%                 partial derivatives w.r.t. to each element of X
%        Theta_grad - num_users x num_features matrix, containing the
%                     partial derivatives w.r.t. to each element of Theta
%


% =============================================================

grad = [X_grad(:); Theta_grad(:)];

end
2.2.1 Collaborating filtering cost function
未经过regularization的代价函数如下: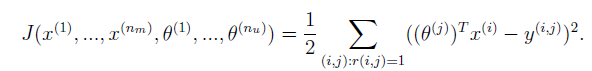
故增加如下代码:
diff = (X * Theta' - Y);
vari = diff.^2;
J = 1/2 * sum(vari(R == 1));
2.2.2 Collaborating filtering gradient
公式如下:
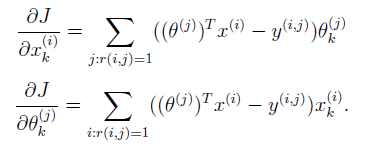
按照文档里的Tips进行向量化,加入如下代码:
for i = 1: num_movies,
  X_grad(i,:) = sum(((diff(i,:).* R(i,:))'.* Theta));
end;

for j = 1: num_users,
  Theta_grad(j,:) = sum(((diff(:,j).* R(:,j)) .* X));
end;
想了一会,发现好像可以更彻底地向量化:
X_grad = diff.* R * Theta;
Theta_grad = (diff.*R)' * X;
2.2.3 Regularized cost function
2.2.4 Regularized gradient
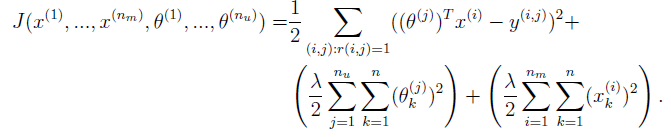
只需要在上述代码中加入regularization的部分即可。
如下:
J = 1/2 * sum(vari(R == 1)) + lambda/2 * (sum((Theta.^2)(:)) + sum((X.^2)(:)));

X_grad = diff.*R*Theta + lambda * X;
Theta_grad = (diff.*R)' * X + lambda * Theta;
2.3 Learning movie recommendations
2.3.1 Recommendations
在脚本文件中填入自己对movie_list.txt中部分电影的评分。
似乎提供的电影都是新世纪以前上映的,因此我没有看过太多。我挑选了如下几部评分: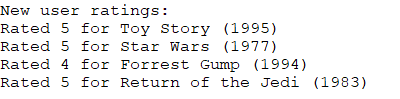
推荐系统给我推荐了如下电影: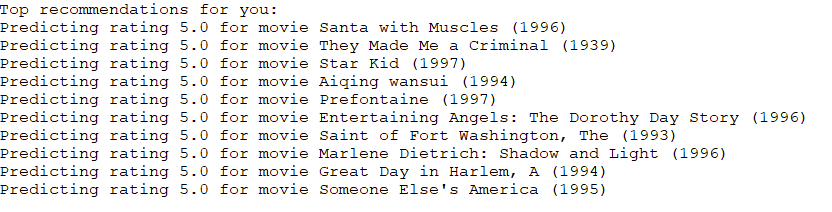
我没有办法判断准不准,因为我一部也没有看过。但随便搜了其中的几部,感觉我可能并不会喜欢。
也许是我提供的样本太小了,也许是这个推荐系统太简陋了吧。

 浙公网安备 33010602011771号